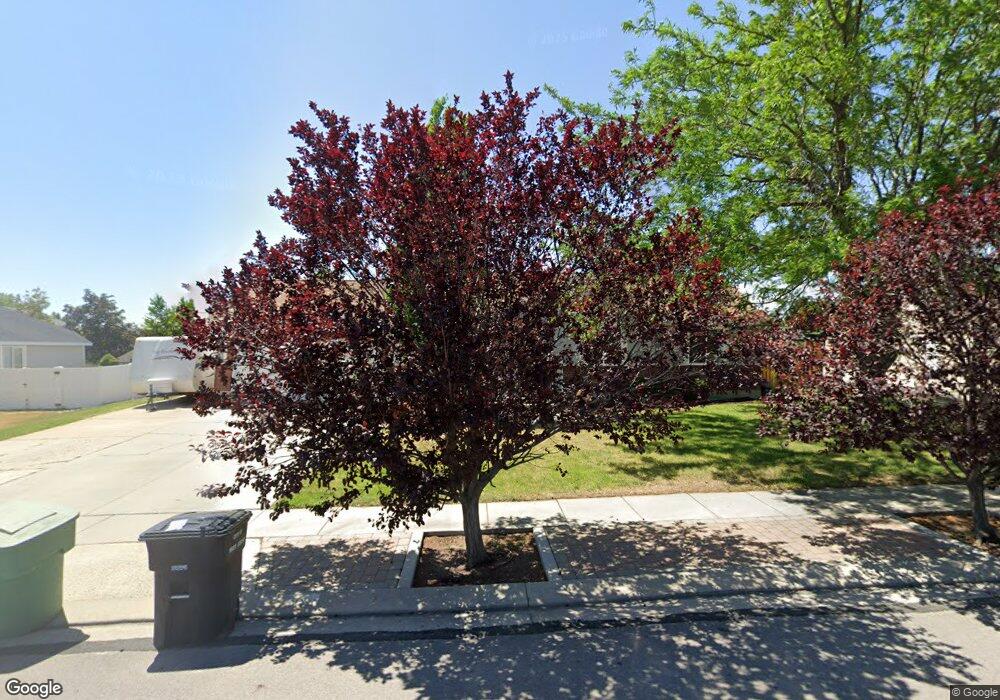
4605 W Dorilee Dr West Jordan, UT 84088
Jordan Oaks NeighborhoodEstimated Value: $584,000 - $636,000
4
Beds
2
Baths
3,012
Sq Ft
$201/Sq Ft
Est. Value
About This Home
This home is located at 4605 W Dorilee Dr, West Jordan, UT 84088 and is currently estimated at $604,924, approximately $200 per square foot. 4605 W Dorilee Dr is a home located in Salt Lake County with nearby schools including Jordan Hills Elementary School, West Hills Middle School, and Copper Hills High School.
Ownership History
Date
Name
Owned For
Owner Type
Purchase Details
Closed on
Jun 20, 2018
Sold by
Clegg Darrel G and Clegg Shauna J
Bought by
Villalvazo Jose Luna and Luna Jessica W
Current Estimated Value
Home Financials for this Owner
Home Financials are based on the most recent Mortgage that was taken out on this home.
Original Mortgage
$233,000
Outstanding Balance
$201,506
Interest Rate
4.5%
Mortgage Type
New Conventional
Estimated Equity
$403,418
Purchase Details
Closed on
Nov 21, 2016
Sold by
Clegg Darrel G and Clegg Shuana Jo
Bought by
Clegg Darrel G and Clegg Shauna J
Home Financials for this Owner
Home Financials are based on the most recent Mortgage that was taken out on this home.
Original Mortgage
$98,500
Interest Rate
2.76%
Mortgage Type
New Conventional
Purchase Details
Closed on
Dec 3, 2010
Sold by
Clegg Darrell G and Clegg Shauna Jo
Bought by
Clegg Darrel G and Clegg Shauna Jo
Home Financials for this Owner
Home Financials are based on the most recent Mortgage that was taken out on this home.
Original Mortgage
$154,000
Interest Rate
3.63%
Mortgage Type
New Conventional
Purchase Details
Closed on
Jul 26, 2004
Sold by
Clegg Darrel G and Clegg Shauna Jo
Bought by
Celgg Darrell G and Clegg Shauna Jo
Home Financials for this Owner
Home Financials are based on the most recent Mortgage that was taken out on this home.
Original Mortgage
$168,115
Interest Rate
5.97%
Mortgage Type
FHA
Purchase Details
Closed on
Mar 6, 2002
Sold by
Furse Troy A
Bought by
Clegg Darrel G and Clegg Shauna Jo
Home Financials for this Owner
Home Financials are based on the most recent Mortgage that was taken out on this home.
Original Mortgage
$167,779
Interest Rate
6.94%
Mortgage Type
FHA
Purchase Details
Closed on
Apr 28, 1998
Sold by
Furse Troy A and Edgar Jenni L
Bought by
Furse Troy A
Home Financials for this Owner
Home Financials are based on the most recent Mortgage that was taken out on this home.
Original Mortgage
$148,500
Interest Rate
7.05%
Purchase Details
Closed on
Mar 15, 1996
Sold by
Ferran Troy
Bought by
Furse Troy A and Edgar Jenni L
Home Financials for this Owner
Home Financials are based on the most recent Mortgage that was taken out on this home.
Original Mortgage
$120,650
Interest Rate
7.05%
Purchase Details
Closed on
Dec 14, 1995
Sold by
Canyon Ranches L C
Bought by
Ferran Troy
Home Financials for this Owner
Home Financials are based on the most recent Mortgage that was taken out on this home.
Original Mortgage
$81,918
Interest Rate
7.47%
Create a Home Valuation Report for This Property
The Home Valuation Report is an in-depth analysis detailing your home's value as well as a comparison with similar homes in the area
Home Values in the Area
Average Home Value in this Area
Purchase History
| Date | Buyer | Sale Price | Title Company |
|---|---|---|---|
| Villalvazo Jose Luna | -- | Old Republic Title Drapper | |
| Clegg Darrel G | -- | Surety Title | |
| Clegg Darrel G | -- | Advanced Title Slc | |
| Celgg Darrell G | -- | Preferred Title & Escrow Ins | |
| Clegg Darrel G | -- | Guardian Title | |
| Furse Troy A | -- | -- | |
| Furse Troy A | -- | -- | |
| Ferran Troy | -- | -- |
Source: Public Records
Mortgage History
| Date | Status | Borrower | Loan Amount |
|---|---|---|---|
| Open | Villalvazo Jose Luna | $233,000 | |
| Previous Owner | Clegg Darrel G | $98,500 | |
| Previous Owner | Clegg Darrel G | $154,000 | |
| Previous Owner | Celgg Darrell G | $168,115 | |
| Previous Owner | Clegg Darrel G | $167,779 | |
| Previous Owner | Furse Troy A | $148,500 | |
| Previous Owner | Furse Troy A | $120,650 | |
| Previous Owner | Ferran Troy | $81,918 | |
| Closed | Ferran Troy | $17,418 |
Source: Public Records
Tax History Compared to Growth
Tax History
| Year | Tax Paid | Tax Assessment Tax Assessment Total Assessment is a certain percentage of the fair market value that is determined by local assessors to be the total taxable value of land and additions on the property. | Land | Improvement |
|---|---|---|---|---|
| 2025 | $2,901 | $565,000 | $186,100 | $378,900 |
| 2024 | $2,901 | $558,200 | $184,200 | $374,000 |
| 2023 | $2,940 | $533,100 | $173,800 | $359,300 |
| 2022 | $2,857 | $509,700 | $170,300 | $339,400 |
| 2021 | $2,416 | $392,400 | $132,400 | $260,000 |
| 2020 | $2,257 | $344,000 | $132,400 | $211,600 |
| 2019 | $2,224 | $332,300 | $125,000 | $207,300 |
| 2018 | $2,100 | $311,300 | $125,000 | $186,300 |
| 2017 | $1,979 | $292,100 | $125,000 | $167,100 |
| 2016 | $1,923 | $266,600 | $125,000 | $141,600 |
| 2015 | $2,020 | $273,100 | $132,100 | $141,000 |
| 2014 | $1,864 | $248,100 | $121,400 | $126,700 |
Source: Public Records
Map
Nearby Homes
- 4624 Pine Crossing Dr
- 4887 W 8620 S
- 8359 Etude Dr
- 7903 Mckenzie Ln
- 7886 Mckenzie Ln
- 8941 S Sun Leaf Dr
- 8577 Autumn Gold Cir
- 8322 Copper Vista Cir
- 5098 Cherry Laurel Ln
- 4707 W Granada Hills Ct
- 8400 S 4000 W Unit 134
- 7973 S Nebo Dr
- 4678 Emmons Dr
- 3931 W Dansere Cir
- 4904 Wild Acres Dr
- 8441 S Spratling Dr
- 3888 W 8700 S
- 9353 S 4460 W
- 8453 S Windmill Dr
- 3977 W Elwood Way
- 4605 Dorilee Dr
- 4621 Dorilee Dr
- 4589 Dorilee Dr
- 4589 W Dorilee Dr
- 4602 Copper Pot Ln
- 4586 Copper Pot Ln
- 4586 W Copper Pot Ln
- 4604 Dorilee Dr
- 4618 Copper Pot Ln
- 4604 W Dorilee Dr
- 4637 Dorilee Dr
- 4637 W Dorilee Dr
- 4622 Dorilee Dr
- 4571 Dorilee Dr
- 4586 Dorilee Dr
- 8652 Saralee Dr
- 4572 Copper Pot Ln
- 8551 Saralee Dr
- 4638 Dorilee Dr
- 8655 Saralee Dr