4606 Dukes Rd Waycross, GA 31503
Estimated payment $3,203/month
Highlights
- In Ground Pool
- Covered Patio or Porch
- Forced Air Heating and Cooling System
- Waresboro Elementary School Rated 9+
- Detached Garage
- Partially Fenced Property
About This Home
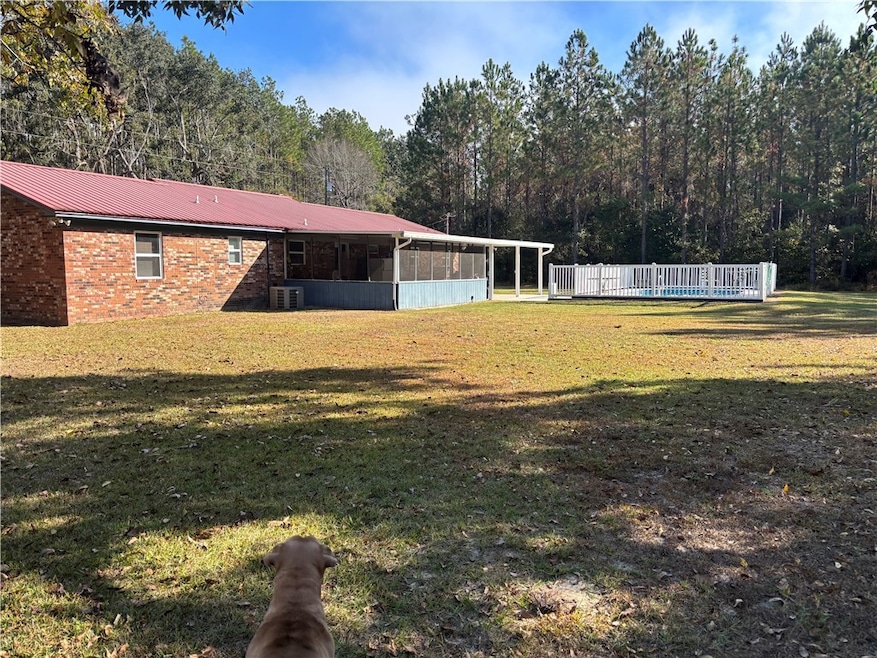
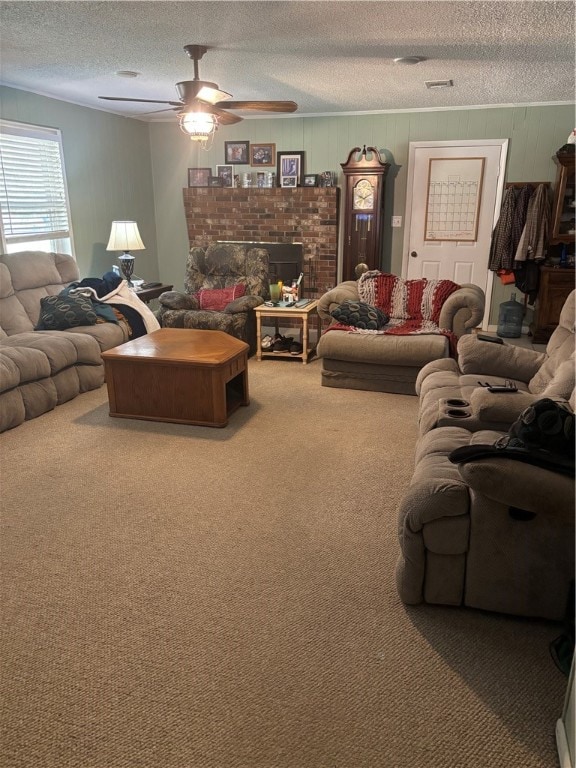
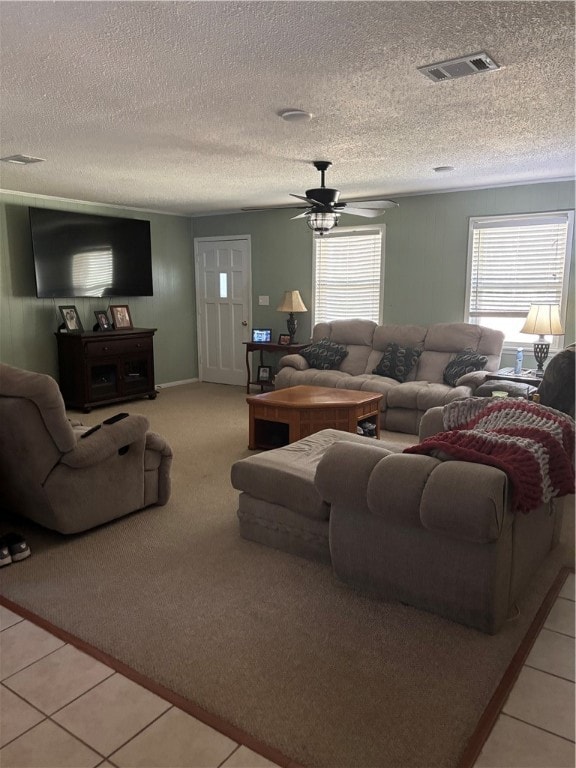
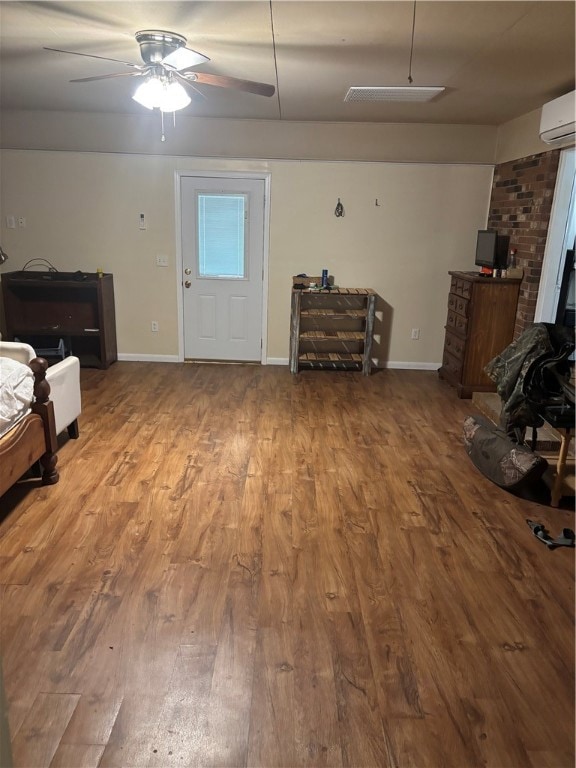
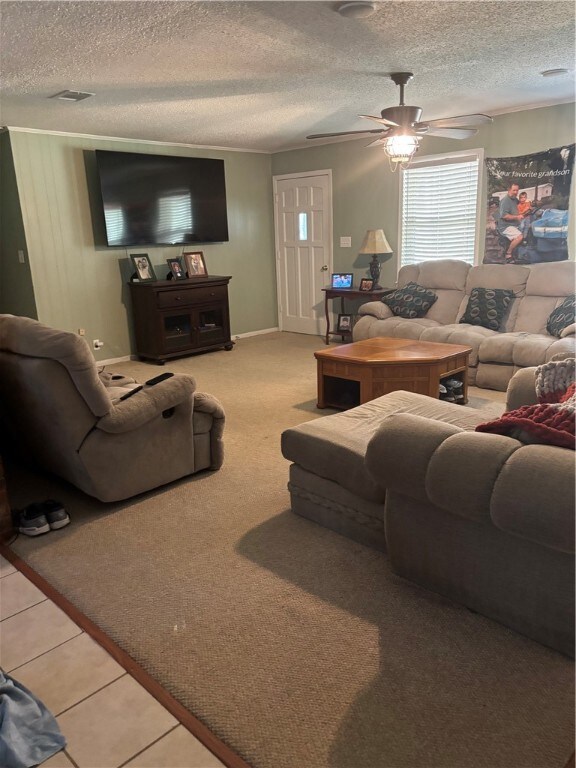
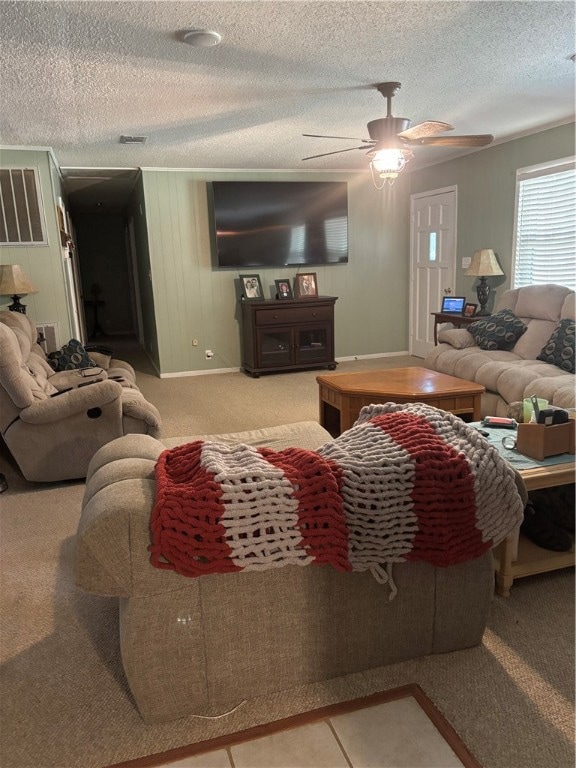
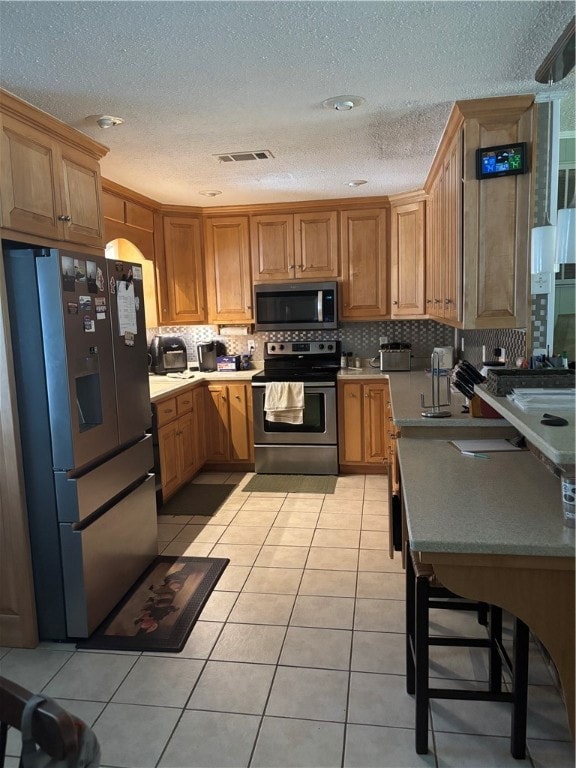
Country Living at Its Best – 3BR/2BA Home on 17.6 Acres in Rural Waresboro! Escape to peace and privacy with this beautiful 3-bedroom, 2-bath home set on 17.6 acres of scenic countryside in rural Waresboro. Perfect for anyone seeking space, serenity, and a little slice of country paradise! This charming home features a spacious open floor plan, updated kitchen, and cozy living areas ideal for family gatherings or quiet evenings at home. The primary suite offers plenty of room to unwind, while two additional bedrooms provide comfort and flexibility for guests or an office. Outside, enjoy your own private acreage—ideal for horses, gardening, or simply soaking in the peaceful surroundings. A large shop offers the perfect setup for a man cave, workshop, or storage for all your toys and tools. Highlights: 3 Bedrooms / 2 Baths 17.6 Beautiful Acres Spacious Shop / Man Cave Peaceful Rural Setting Endless Possibilities for Outdoor Living Don’t miss your chance to own this rare find in Waresboro—where country charm meets modern comfort!

Home Details
Home Type
- Single Family
Est. Annual Taxes
- $2,072
Year Built
- Built in 1980
Lot Details
- 17.6 Acre Lot
- Partially Fenced Property
- Vinyl Fence
Parking
- Detached Garage
Home Design
- 1,856 Sq Ft Home
- Brick Exterior Construction
- Concrete Perimeter Foundation
Bedrooms and Bathrooms
- 4 Bedrooms
- 2 Full Bathrooms
Outdoor Features
- In Ground Pool
- Covered Patio or Porch
Utilities
- Forced Air Heating and Cooling System
- Heat Pump System
Listing and Financial Details
- Assessor Parcel Number 049 01 028 B
Map
Home Values in the Area
Average Home Value in this Area
Tax History
| Year | Tax Paid | Tax Assessment Tax Assessment Total Assessment is a certain percentage of the fair market value that is determined by local assessors to be the total taxable value of land and additions on the property. | Land | Improvement |
|---|---|---|---|---|
| 2024 | $2,072 | $82,128 | $16,269 | $65,859 |
| 2023 | $2,114 | $77,865 | $15,134 | $62,731 |
| 2022 | $2,248 | $77,865 | $15,134 | $62,731 |
| 2021 | $1,965 | $62,657 | $11,641 | $51,016 |
| 2020 | $1,933 | $60,971 | $11,641 | $49,330 |
| 2019 | $1,917 | $59,286 | $11,641 | $47,645 |
| 2018 | $1,880 | $57,600 | $11,641 | $45,959 |
| 2017 | $1,807 | $57,600 | $11,641 | $45,959 |
| 2016 | $1,807 | $57,600 | $11,641 | $45,959 |
| 2015 | $1,620 | $51,238 | $5,280 | $45,959 |
| 2014 | $1,618 | $51,239 | $5,280 | $45,959 |
| 2013 | -- | $51,238 | $5,280 | $45,958 |
Property History
| Date | Event | Price | List to Sale | Price per Sq Ft |
|---|---|---|---|---|
| 11/07/2025 11/07/25 | For Sale | $575,000 | -- | $310 / Sq Ft |
Purchase History
| Date | Type | Sale Price | Title Company |
|---|---|---|---|
| Warranty Deed | -- | -- | |
| Warranty Deed | -- | -- | |
| Warranty Deed | -- | -- | |
| Gift Deed | -- | -- | |
| Deed | $65,000 | -- |
Mortgage History
| Date | Status | Loan Amount | Loan Type |
|---|---|---|---|
| Open | $80,000 | New Conventional |
Source: Golden Isles Association of REALTORS®
MLS Number: 1657861
APN: 049-01-028-B
Disclaimer: Certain information contained herein is derived from information provided by parties other than Homes.com. All information provided is deemed reliable, but is not guaranteed to be accurate and should be independently verified.
![]() IDX information is provided exclusively for personal, non-commercial use, and may not be used for any purpose other than to identify prospective properties consumers may be interested in purchasing. Information is deemed reliable but not guaranteed.
IDX information is provided exclusively for personal, non-commercial use, and may not be used for any purpose other than to identify prospective properties consumers may be interested in purchasing. Information is deemed reliable but not guaranteed.
- 3940 Cleve Rd
- 4427 Pine Valley Rd
- 4601 Old Scapa Ln
- S S River Rd
- 4525 Oak View Rd
- 4545 Oak View Cir
- 4535 Oak View Cir
- 4717 Smith Ln
- 0 (Lot 19) Smith Ln
- Lot 2 Smith Ln
- 0 Perch Creek Trail Unit 10600480
- 4517 Cameron Ln
- 4600 Alma Hwy
- 2180 Fulford Rd Unit n/a
- 4601 Alma Hwy
- 4263 N River Rd
- 465 Oe McDonald Rd
- 0 Odum Rd
- 6007 Quick Draw Rd
- 6176 Perch Creek Trail