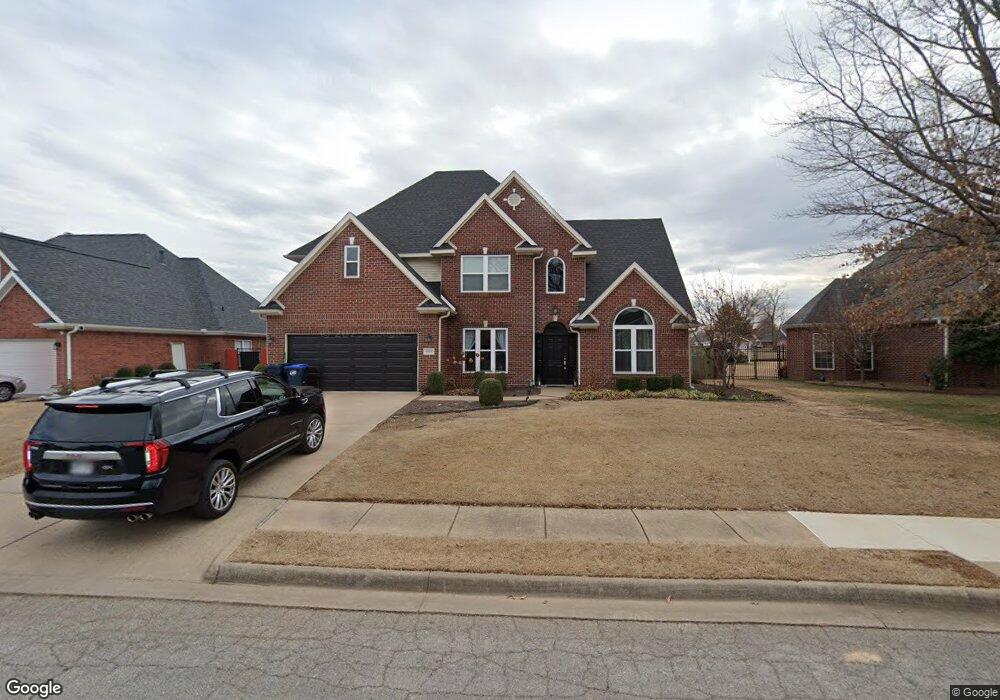
4606 Knoll View Way Rogers, AR 72758
Estimated Value: $524,106 - $560,000
--
Bed
3
Baths
2,300
Sq Ft
$236/Sq Ft
Est. Value
About This Home
This home is located at 4606 Knoll View Way, Rogers, AR 72758 and is currently estimated at $542,027, approximately $235 per square foot. 4606 Knoll View Way is a home located in Benton County with nearby schools including Bellview Elementary School, Kirksey Middle School, and Rogers High School.
Ownership History
Date
Name
Owned For
Owner Type
Purchase Details
Closed on
May 10, 2007
Sold by
Martin Eric J and Martin Beverly A
Bought by
Laird James A and Laird Roselyn F
Current Estimated Value
Home Financials for this Owner
Home Financials are based on the most recent Mortgage that was taken out on this home.
Original Mortgage
$240,000
Outstanding Balance
$146,383
Interest Rate
6.22%
Mortgage Type
Purchase Money Mortgage
Estimated Equity
$395,644
Purchase Details
Closed on
Feb 16, 2006
Sold by
Lauschke Linda M and Lauschke Paul
Bought by
Prudential Relocation Inc
Home Financials for this Owner
Home Financials are based on the most recent Mortgage that was taken out on this home.
Original Mortgage
$221,600
Interest Rate
8.99%
Mortgage Type
Adjustable Rate Mortgage/ARM
Purchase Details
Closed on
Oct 11, 1999
Bought by
Lauschke
Purchase Details
Closed on
Sep 13, 1999
Bought by
Lauschke Paul
Purchase Details
Closed on
Jun 3, 1900
Bought by
Puttkammer
Create a Home Valuation Report for This Property
The Home Valuation Report is an in-depth analysis detailing your home's value as well as a comparison with similar homes in the area
Home Values in the Area
Average Home Value in this Area
Purchase History
| Date | Buyer | Sale Price | Title Company |
|---|---|---|---|
| Laird James A | $232,000 | Cleartitle | |
| Prudential Relocation Inc | -- | None Available | |
| Lauschke | $212,000 | -- | |
| Lauschke Paul | -- | -- | |
| Puttkammer | $31,000 | -- |
Source: Public Records
Mortgage History
| Date | Status | Borrower | Loan Amount |
|---|---|---|---|
| Open | Laird James A | $240,000 | |
| Previous Owner | Prudential Relocation Inc | $221,600 |
Source: Public Records
Tax History Compared to Growth
Tax History
| Year | Tax Paid | Tax Assessment Tax Assessment Total Assessment is a certain percentage of the fair market value that is determined by local assessors to be the total taxable value of land and additions on the property. | Land | Improvement |
|---|---|---|---|---|
| 2025 | $3,444 | $91,509 | $20,000 | $71,509 |
| 2024 | $3,207 | $91,509 | $20,000 | $71,509 |
| 2023 | $3,054 | $60,160 | $15,000 | $45,160 |
| 2022 | $2,662 | $60,160 | $15,000 | $45,160 |
| 2021 | $2,517 | $60,160 | $15,000 | $45,160 |
| 2020 | $2,381 | $50,200 | $12,800 | $37,400 |
| 2019 | $2,381 | $50,200 | $12,800 | $37,400 |
| 2018 | $2,406 | $50,200 | $12,800 | $37,400 |
| 2017 | $2,178 | $50,200 | $12,800 | $37,400 |
| 2016 | $2,178 | $50,200 | $12,800 | $37,400 |
| 2015 | $2,400 | $45,360 | $8,000 | $37,360 |
| 2014 | $2,050 | $45,360 | $8,000 | $37,360 |
Source: Public Records
Map
Nearby Homes
- 1.45AC W Pleasant Grove Rd
- 4625 S 47th St
- 4601 S 47th St
- 4619 S 47th St
- 4605 S 47th St
- 4621 S 47th St
- 4607 S 47th St
- 4603 S 47th St
- 4609 S 47th St
- 4613 S 47th St
- 4617 S 47th St
- 5305 S 44th Place
- 5308 Whispering Meadows Ln
- 4414 Hillside Dr
- 4509 Creekview Dr
- 4409 W Hillside Dr
- 4412 W Arlington Dr
- 79 AC W Pleasant Grove Rd
- 2.92 AC W Pleasant Grove Rd
- 11.3 AC W Pleasant Grove Rd
- 4608 Knoll View Way
- 4604 Knoll View Way
- 4604 W Knoll View Way
- 4610 Knoll View Way
- 4602 Knoll View Way
- 4605 Knoll View Way
- 4607 W Knoll View Way
- 4607 Knoll View Way
- 4603 Knoll View Way
- 4612 Knoll View Way
- 4609 Knoll View Way
- 4639 W Pleasant Grove Rd
- 4601 Knoll View Way
- 4601 W Knoll View Way
- 4600 Knoll View Way
- 4611 W Knoll View Way
- 4611 Knoll View Way
- 4614 W Knoll View Way
- 4614 Knoll View Way
- 4604 Pleasant Dr