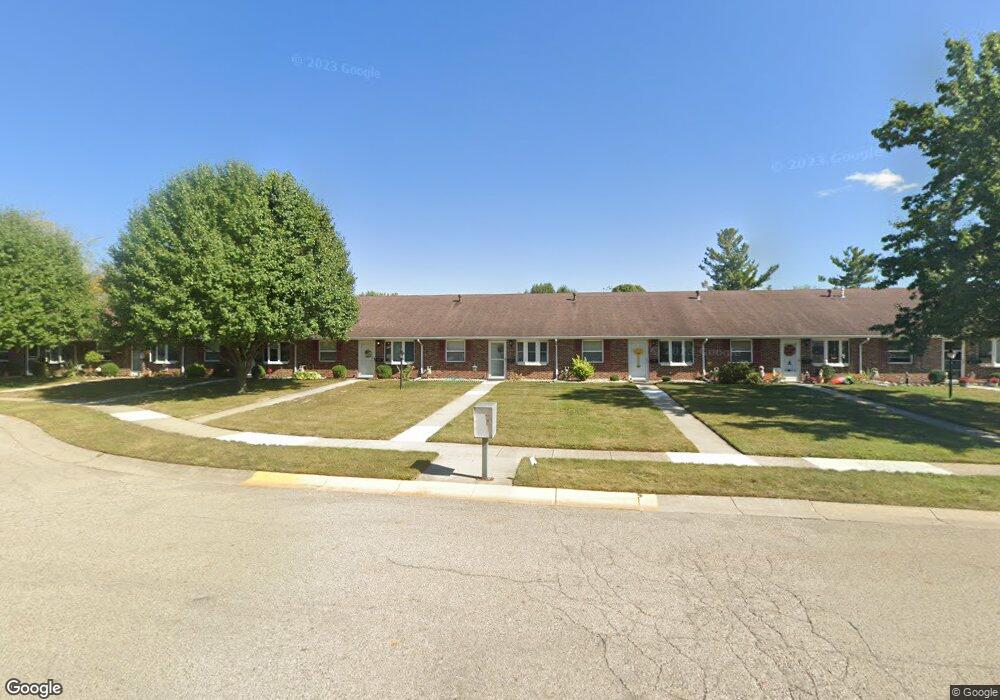
4606 Reno Ln Unit 4 Springfield, OH 45503
Estimated Value: $140,000 - $150,000
2
Beds
2
Baths
1,032
Sq Ft
$141/Sq Ft
Est. Value
About This Home
This home is located at 4606 Reno Ln Unit 4, Springfield, OH 45503 and is currently estimated at $145,189, approximately $140 per square foot. 4606 Reno Ln Unit 4 is a home located in Clark County with nearby schools including Northridge Elementary School, Kenton Ridge Middle & High School, and Emmanuel Christian Academy.
Ownership History
Date
Name
Owned For
Owner Type
Purchase Details
Closed on
Oct 17, 2012
Sold by
Ratliff Lisa L and Stephenson Nickilynn
Bought by
Evans Clifford and Evans Nickilynn
Current Estimated Value
Purchase Details
Closed on
Apr 30, 2007
Sold by
Colleary Marsha E Massie and Massie Marsha E
Bought by
Stephenson Nickilynn and Ratliff Lisa L
Home Financials for this Owner
Home Financials are based on the most recent Mortgage that was taken out on this home.
Original Mortgage
$15,000
Interest Rate
6.2%
Mortgage Type
Purchase Money Mortgage
Purchase Details
Closed on
Sep 1, 2004
Sold by
Riley Marilyn C and Riley Roy R
Bought by
Massie Marsha E
Home Financials for this Owner
Home Financials are based on the most recent Mortgage that was taken out on this home.
Original Mortgage
$82,500
Outstanding Balance
$40,599
Interest Rate
6.1%
Mortgage Type
Purchase Money Mortgage
Estimated Equity
$104,590
Purchase Details
Closed on
Jun 30, 1995
Sold by
Hoppes Builders & Dev Co
Bought by
Reaver Nelson P and Reaver Vickie E
Create a Home Valuation Report for This Property
The Home Valuation Report is an in-depth analysis detailing your home's value as well as a comparison with similar homes in the area
Home Values in the Area
Average Home Value in this Area
Purchase History
| Date | Buyer | Sale Price | Title Company |
|---|---|---|---|
| Evans Clifford | -- | None Available | |
| Stephenson Nickilynn | $84,000 | Attorney | |
| Massie Marsha E | $82,500 | -- | |
| Reaver Nelson P | $59,800 | -- |
Source: Public Records
Mortgage History
| Date | Status | Borrower | Loan Amount |
|---|---|---|---|
| Closed | Stephenson Nickilynn | $15,000 | |
| Open | Massie Marsha E | $82,500 |
Source: Public Records
Tax History
| Year | Tax Paid | Tax Assessment Tax Assessment Total Assessment is a certain percentage of the fair market value that is determined by local assessors to be the total taxable value of land and additions on the property. | Land | Improvement |
|---|---|---|---|---|
| 2025 | $1,184 | $42,980 | $7,050 | $35,930 |
| 2024 | $1,145 | $27,070 | $5,730 | $21,340 |
| 2023 | $1,145 | $27,070 | $5,730 | $21,340 |
| 2022 | $1,149 | $27,070 | $5,730 | $21,340 |
| 2021 | $1,319 | $26,330 | $4,380 | $21,950 |
| 2020 | $1,320 | $26,330 | $4,380 | $21,950 |
| 2019 | $1,345 | $26,330 | $4,380 | $21,950 |
| 2018 | $1,222 | $22,970 | $5,250 | $17,720 |
| 2017 | $1,048 | $23,863 | $5,250 | $18,613 |
| 2016 | $1,040 | $23,863 | $5,250 | $18,613 |
| 2015 | $1,174 | $25,680 | $5,250 | $20,430 |
| 2014 | $1,174 | $25,680 | $5,250 | $20,430 |
| 2013 | $1,147 | $25,680 | $5,250 | $20,430 |
Source: Public Records
Map
Nearby Homes
- 4652 Reno Ln Unit 15
- 4577 Reno Ln Unit 2
- 4732 Lehigh Dr
- 4446 Ridgewood Rd E Unit 3
- 4890 Brannan Dr W Unit 4890
- 4322 Midfield St Unit 15
- 5033 Ridgewood Rd E
- 4256 Midfield St Unit 9
- 1341 Student Ave
- 4802 Willowbrook Dr
- 1521 Erika Dr
- 1644 Delmar Dr
- 4741 Cullen Ave
- 3942 Harris Ln
- 4500 Bosart Rd
- 1921 Elaina Dr
- 4028 Ryland Dr Unit 4028
- 5564 Ridgewood Rd E Unit 7
- 1495 Victorian Way
- 5564 Ridgewood Rd W
- 4608 Reno Ln Unit 5
- 4604 Reno Ln
- 4610 Reno Ln Unit 6
- 4602 Reno Ln
- 4602 Reno Ln Unit 2
- 4612 Reno Ln
- 4600 Reno Ln Unit 1
- 4614 Reno Ln Unit 8
- 4534 Reno Ln Unit 8
- 4607 Tulane Rd
- 4650 Reno Ln Unit 14
- 4650 Reno Ln
- 4646 Reno Ln Unit 12
- 4646 Reno Ln
- 4644 Reno Ln Unit 11
- 4532 Reno Ln Unit 7
- 4642 Reno Ln Unit 10
- 4642 Reno Ln Unit o
- 4648 Reno Ln
- 4615 Tulane Rd
Your Personal Tour Guide
Ask me questions while you tour the home.