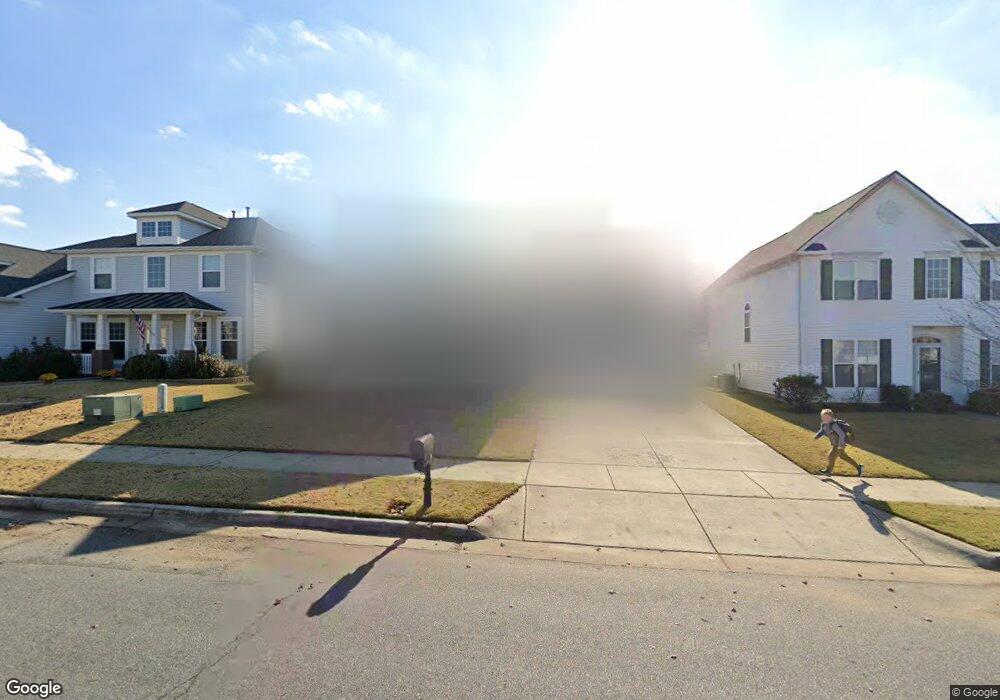
4606 Triumph Dr SW Concord, NC 28027
Estimated Value: $392,462 - $473,000
3
Beds
2
Baths
2,153
Sq Ft
$201/Sq Ft
Est. Value
About This Home
This home is located at 4606 Triumph Dr SW, Concord, NC 28027 and is currently estimated at $433,116, approximately $201 per square foot. 4606 Triumph Dr SW is a home located in Cabarrus County with nearby schools including Pitts School Road Elementary School, Roberta Road Middle School, and Jay M. Robinson High School.
Ownership History
Date
Name
Owned For
Owner Type
Purchase Details
Closed on
Jun 14, 2016
Sold by
Jones Virginia E and Jones Wallace L
Bought by
Jones Wallace L
Current Estimated Value
Home Financials for this Owner
Home Financials are based on the most recent Mortgage that was taken out on this home.
Original Mortgage
$168,686
Outstanding Balance
$132,970
Interest Rate
3.61%
Mortgage Type
VA
Estimated Equity
$300,146
Purchase Details
Closed on
May 16, 2008
Sold by
M/I Homes Of Charlotte Llc
Bought by
Jones Wallace L and Jones Virginia E
Home Financials for this Owner
Home Financials are based on the most recent Mortgage that was taken out on this home.
Original Mortgage
$173,800
Interest Rate
5.86%
Mortgage Type
Purchase Money Mortgage
Create a Home Valuation Report for This Property
The Home Valuation Report is an in-depth analysis detailing your home's value as well as a comparison with similar homes in the area
Home Values in the Area
Average Home Value in this Area
Purchase History
| Date | Buyer | Sale Price | Title Company |
|---|---|---|---|
| Jones Wallace L | -- | None Available | |
| Jones Wallace L | $243,000 | Transohio Residential Title |
Source: Public Records
Mortgage History
| Date | Status | Borrower | Loan Amount |
|---|---|---|---|
| Open | Jones Wallace L | $168,686 | |
| Closed | Jones Wallace L | $173,800 |
Source: Public Records
Tax History
| Year | Tax Paid | Tax Assessment Tax Assessment Total Assessment is a certain percentage of the fair market value that is determined by local assessors to be the total taxable value of land and additions on the property. | Land | Improvement |
|---|---|---|---|---|
| 2025 | $3,805 | $382,030 | $100,000 | $282,030 |
| 2024 | $3,805 | $382,030 | $100,000 | $282,030 |
| 2023 | $2,982 | $244,450 | $58,000 | $186,450 |
| 2022 | $2,982 | $244,450 | $58,000 | $186,450 |
| 2021 | $2,982 | $244,450 | $58,000 | $186,450 |
| 2020 | $2,982 | $244,450 | $58,000 | $186,450 |
| 2019 | $2,474 | $202,800 | $36,000 | $166,800 |
| 2018 | $2,434 | $202,800 | $36,000 | $166,800 |
| 2017 | $2,393 | $202,800 | $36,000 | $166,800 |
| 2016 | $1,420 | $176,360 | $28,000 | $148,360 |
| 2015 | $2,081 | $176,360 | $28,000 | $148,360 |
| 2014 | $2,081 | $176,360 | $28,000 | $148,360 |
Source: Public Records
Map
Nearby Homes
- 5307 Bendix Ct
- 4349 Roberta Rd
- 3693 Stonefield St SW
- 4463 Legend St SW
- 4444 Bravery Place SW Unit 116
- 5421 Roberta Meadows Ct
- 4271 Maybrook Ct SW
- 842 Treva Anne Dr SW
- 855 Juanita Dr SW
- 4266 Barley St SW
- 248 Corrie Ann Dr
- 4570 Lanstone Ct SW
- 5361 Brickyard Terrace Ct
- 4122 Amarillo Dr SW
- 3455 Roberta Rd
- 3907 Melissa Dr
- 3913 Stough Rd
- 781 King Fredrick Ln SW Unit 207
- 3369 Roberta Rd
- 3770 Roberta Church Rd SW
- 4610 Triumph Dr SW
- 4602 Triumph Dr SW
- 4910 Juniper Grove Ct SW
- 4906 Juniper Grove Ct SW
- 4596 Triumph Dr SW
- 3608 Grove Creek Pond Dr SW
- 3604 Grove Creek Pond Dr SW
- 4914 Juniper Grove Ct SW
- 4918 Juniper Grove Ct SW
- 4609 Triumph Dr SW
- 4613 Triumph Dr SW
- 4605 Triumph Dr SW
- 3612 Grove Creek Pond Dr SW
- 4592 Triumph Dr SW
- 3616 Grove Creek Pond Dr SW
- 4593 Triumph Dr SW
- 4922 Juniper Grove Ct SW
- 3624 Grove Creek Pond Dr SW
- 3856 Larkhaven Ave SW
- 4617 Triumph Dr SW
Your Personal Tour Guide
Ask me questions while you tour the home.