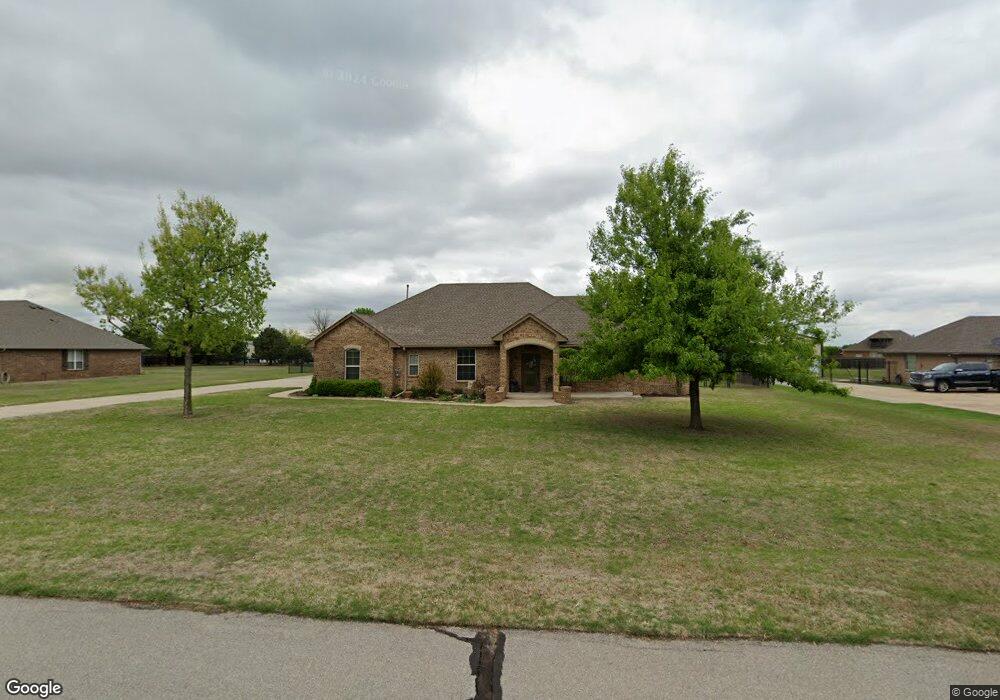
4607 Creekside Dr Tuttle, OK 73089
Estimated Value: $381,932 - $478,000
3
Beds
3
Baths
2,186
Sq Ft
$191/Sq Ft
Est. Value
About This Home
This home is located at 4607 Creekside Dr, Tuttle, OK 73089 and is currently estimated at $417,233, approximately $190 per square foot. 4607 Creekside Dr is a home with nearby schools including Tuttle Elementary School, Tuttle Intermediate School, and Tuttle Middle School.
Ownership History
Date
Name
Owned For
Owner Type
Purchase Details
Closed on
Jan 17, 2022
Sold by
Coots Rodney E and Coots Tia L
Bought by
Rodney E Tia L Coots Living Trust
Current Estimated Value
Purchase Details
Closed on
Jan 17, 2013
Sold by
Andrews Kaye L and Andrews John
Bought by
Coots Rodney E and Coots Tia L
Home Financials for this Owner
Home Financials are based on the most recent Mortgage that was taken out on this home.
Original Mortgage
$191,920
Interest Rate
3.33%
Mortgage Type
New Conventional
Purchase Details
Closed on
Dec 15, 2010
Sold by
Asset Marketing & Management Inc
Bought by
Andrews Kaye L
Home Financials for this Owner
Home Financials are based on the most recent Mortgage that was taken out on this home.
Original Mortgage
$212,038
Interest Rate
4.24%
Mortgage Type
VA
Purchase Details
Closed on
Mar 23, 2010
Sold by
River Ridge Estates Llc
Bought by
Asset Marketing & Managem
Create a Home Valuation Report for This Property
The Home Valuation Report is an in-depth analysis detailing your home's value as well as a comparison with similar homes in the area
Home Values in the Area
Average Home Value in this Area
Purchase History
| Date | Buyer | Sale Price | Title Company |
|---|---|---|---|
| Rodney E Tia L Coots Living Trust | $13,333 | None Listed On Document | |
| Coots Rodney E | $240,000 | None Available | |
| Andrews Kaye L | $220,000 | None Available | |
| Asset Marketing & Managem | $32,000 | -- |
Source: Public Records
Mortgage History
| Date | Status | Borrower | Loan Amount |
|---|---|---|---|
| Previous Owner | Coots Rodney E | $191,920 | |
| Previous Owner | Andrews Kaye L | $212,038 |
Source: Public Records
Tax History Compared to Growth
Tax History
| Year | Tax Paid | Tax Assessment Tax Assessment Total Assessment is a certain percentage of the fair market value that is determined by local assessors to be the total taxable value of land and additions on the property. | Land | Improvement |
|---|---|---|---|---|
| 2025 | $3,819 | $37,252 | $4,048 | $33,204 |
| 2024 | $3,995 | $36,167 | $3,931 | $32,236 |
| 2023 | $3,995 | $35,114 | $4,273 | $30,841 |
| 2022 | $3,635 | $34,092 | $4,157 | $29,935 |
| 2021 | $3,540 | $33,099 | $4,510 | $28,589 |
| 2020 | $3,470 | $32,135 | $4,343 | $27,792 |
| 2019 | $3,307 | $31,199 | $4,314 | $26,885 |
| 2018 | $3,030 | $30,291 | $4,300 | $25,991 |
| 2017 | $3,014 | $29,408 | $4,168 | $25,240 |
| 2016 | $2,977 | $28,552 | $3,265 | $25,287 |
| 2015 | $2,705 | $27,720 | $2,643 | $25,077 |
| 2014 | $2,705 | $26,400 | $3,520 | $22,880 |
Source: Public Records
Map
Nearby Homes
- 4333 Courtlyn Ave
- 1120 Jozie Way
- 1136 Jozie Way
- 1441 Antler Ridge
- 1300 Colonial Ave
- 4618 Riata Cir
- 1418 Buckhorn Place
- 1137 Jaden Blvd
- 4121 Sambar St
- 1455 Deer Ridge Run
- 4113 Sambar St
- 4608 Riata Cir
- 4426 Violet St
- 1409 Deer Ridge Run
- 1401 Deer Ridge Run
- 1425 Deer Ridge Run
- 1417 Deer Ridge Run
- 4053 Hart St
- 1127 Deer Ridge
- 4220 Caribou St
- 4609 Creekside Dr
- 4605 Creekside Dr
- 4608 Riverside Dr
- 4606 Riverside Dr
- 4602 Riverside Dr
- 4604 Creekside Dr
- 4604 Riverside Dr
- 4608 Creekside Dr
- 4601 Creekside Dr
- 4600 Creekside Dr
- 4610 Creekside Dr
- 4610 Riverside Dr
- 1707 Bayside Dr
- 4605 Shoreside Dr
- 4607 Shoreside Dr
- 4603 Shoreside Dr
- 4601 Shoreside Dr
- 1721 River Ridge Ln
- 1704 Riverview Dr
- 1706 Riverview Dr