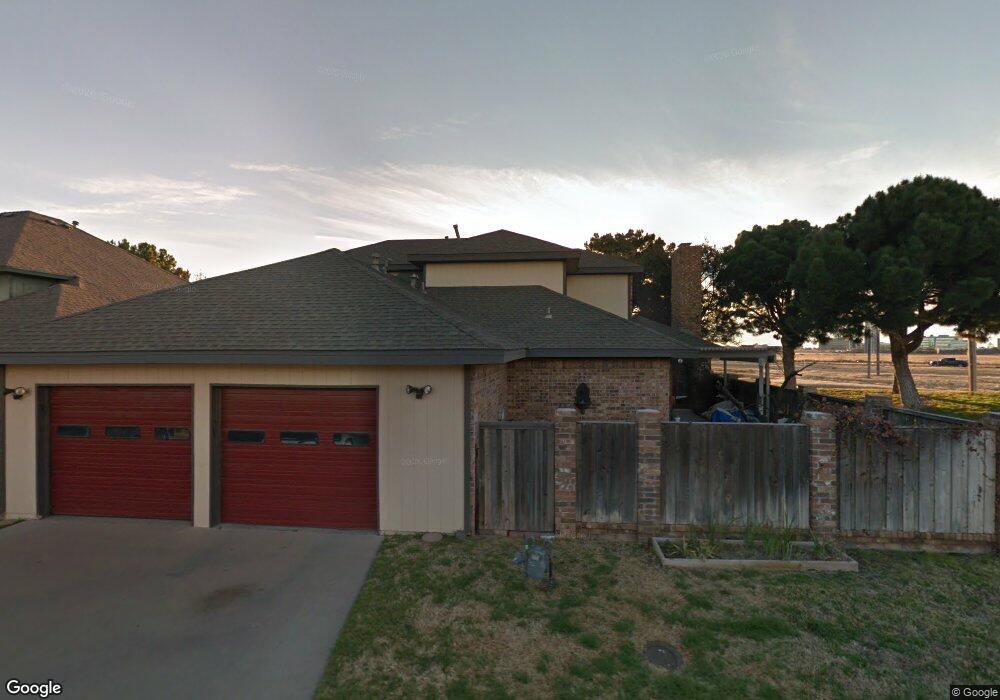
4607 Pine Meadow Dr Unit 1 Midland, TX 79705
Estimated Value: $292,000 - $382,000
--
Bed
2
Baths
2,084
Sq Ft
$167/Sq Ft
Est. Value
About This Home
This home is located at 4607 Pine Meadow Dr Unit 1, Midland, TX 79705 and is currently estimated at $347,169, approximately $166 per square foot. 4607 Pine Meadow Dr Unit 1 is a home located in Midland County with nearby schools including Santa Rita Elementary School, Midland High School, and Midland Freshman High School.
Ownership History
Date
Name
Owned For
Owner Type
Purchase Details
Closed on
Jul 19, 2021
Sold by
Mad Viking Properties Llc
Bought by
Demadrid Belinda Vejar
Current Estimated Value
Home Financials for this Owner
Home Financials are based on the most recent Mortgage that was taken out on this home.
Original Mortgage
$273,809
Outstanding Balance
$248,439
Interest Rate
2.9%
Mortgage Type
FHA
Estimated Equity
$98,730
Purchase Details
Closed on
Jul 21, 2016
Sold by
Mad Viking Properties Llc
Bought by
Mad Viking Properties Llc
Purchase Details
Closed on
Jun 27, 2016
Sold by
Underwood David Lee
Bought by
Mad Viking Properties Llc
Purchase Details
Closed on
Jun 12, 2015
Sold by
Underwood James A
Bought by
Mad Viking Properties Llc
Purchase Details
Closed on
Oct 6, 1987
Bought by
Mad Viking Properties Llc
Create a Home Valuation Report for This Property
The Home Valuation Report is an in-depth analysis detailing your home's value as well as a comparison with similar homes in the area
Home Values in the Area
Average Home Value in this Area
Purchase History
| Date | Buyer | Sale Price | Title Company |
|---|---|---|---|
| Demadrid Belinda Vejar | -- | Stewart Title | |
| Mad Viking Properties Llc | -- | -- | |
| Mad Viking Properties Llc | -- | -- | |
| Mad Viking Properties Llc | -- | -- | |
| Mad Viking Properties Llc | -- | -- |
Source: Public Records
Mortgage History
| Date | Status | Borrower | Loan Amount |
|---|---|---|---|
| Open | Demadrid Belinda Vejar | $273,809 |
Source: Public Records
Tax History Compared to Growth
Tax History
| Year | Tax Paid | Tax Assessment Tax Assessment Total Assessment is a certain percentage of the fair market value that is determined by local assessors to be the total taxable value of land and additions on the property. | Land | Improvement |
|---|---|---|---|---|
| 2024 | $4,556 | $300,040 | $14,240 | $285,800 |
| 2023 | $4,496 | $300,040 | $14,240 | $285,800 |
| 2022 | $4,522 | $289,400 | $14,240 | $275,160 |
| 2021 | $4,441 | $254,930 | $14,240 | $240,690 |
| 2020 | $4,398 | $253,800 | $14,240 | $239,560 |
| 2019 | $4,805 | $253,800 | $14,240 | $239,560 |
| 2018 | $4,589 | $236,020 | $14,240 | $221,780 |
| 2017 | $4,526 | $232,760 | $14,240 | $218,520 |
| 2016 | $4,282 | $219,820 | $14,240 | $205,580 |
| 2015 | -- | $109,910 | $7,120 | $102,790 |
| 2014 | -- | $211,920 | $14,240 | $197,680 |
Source: Public Records
Map
Nearby Homes
- 405 Springwood Ct
- 4814 Spring Meadow Ln
- 4805 Spring Meadow Ln Unit 5
- 4805 Spring Meadow Ln Unit 1
- 4805 Spring Meadow Ln Unit 2
- 509 Meadowpark Dr
- 523 Carol Ln
- 5102 Ashdown Place
- 5103 Ashdown Place
- 2911 Yellowstone Ct
- 317 Solomon Ln
- 7106 Arkose
- 7102 Arkose
- 213 Carol Ln
- 4901 Lancashire Rd
- 4503 Palmer Dr
- 4502 Irwin Ct
- 201 Solomon Ln
- 4902 Los Alamitos Dr
- 4400 Palmer Dr
- 4607 Pine Meadow Dr Unit 2
- 4607 Pine Meadow Dr Unit 3
- 4607 Pine Meadow Dr
- 4605 Meadowwood Ct
- 4603 Meadowwood Ct
- 4607 Meadowwood Ct
- 4705 Spring Meadow Ln
- 4601 Meadowwood Ct
- 410 Spring Meadow Ct
- 410 Spring Meadow Ln
- 4705 Spring Meadow Ln Unit 4
- 4705 Spring Meadow Ln Unit 5
- 4705 Spring Meadow Ln Unit 6
- 4705 Spring Meadow Ln Unit 7
- 4705 Spring Meadow Ln Unit 1
- 4705 Spring Meadow Ln Unit 2
- 4705 Spring Meadow Ln Unit 3
- 4705 Spring Meadow Ln
- 4702 Spring Meadow Ln
- 4700 Spring Meadow Ln