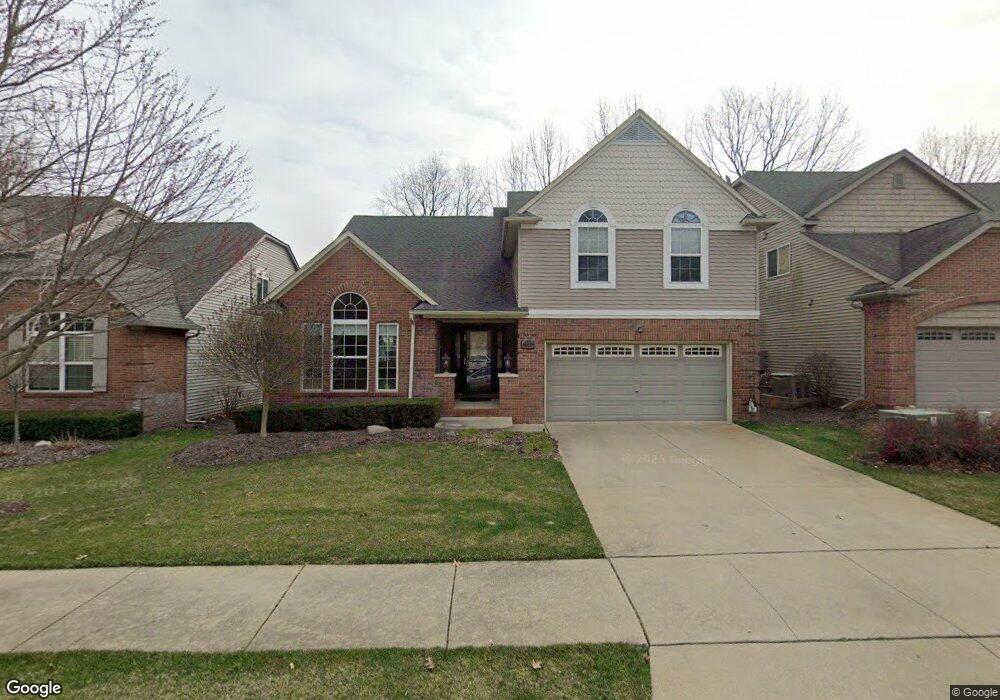
4607 Spring Mountain Dr Unit 19 Brighton, MI 48116
Estimated Value: $509,000 - $530,000
3
Beds
3
Baths
2,238
Sq Ft
$232/Sq Ft
Est. Value
About This Home
This home is located at 4607 Spring Mountain Dr Unit 19, Brighton, MI 48116 and is currently estimated at $518,205, approximately $231 per square foot. 4607 Spring Mountain Dr Unit 19 is a home located in Livingston County with nearby schools including Hilton Road Elementary School, Scranton Middle School, and Brighton High School.
Ownership History
Date
Name
Owned For
Owner Type
Purchase Details
Closed on
Aug 28, 2025
Sold by
Charlene A Knope Revocable Living Trust and Knope Leigh Ann
Bought by
Wasylk Jasmine and Prybylski Justin
Current Estimated Value
Home Financials for this Owner
Home Financials are based on the most recent Mortgage that was taken out on this home.
Original Mortgage
$497,816
Outstanding Balance
$497,816
Interest Rate
6.75%
Mortgage Type
FHA
Estimated Equity
$20,389
Purchase Details
Closed on
Aug 13, 2020
Sold by
Knope Charlene Ann
Bought by
Knope Charlene A
Purchase Details
Closed on
May 26, 2016
Sold by
Knope Charlene Ann
Bought by
Knope Charlene Ann and Frank W Knope And Charlene A Knope Trust
Purchase Details
Closed on
Nov 30, 2009
Sold by
Tcf National Bank
Bought by
Philion Diane Lee
Purchase Details
Closed on
Oct 20, 2009
Sold by
Springhill Development Llc
Bought by
Tcf National Bank
Create a Home Valuation Report for This Property
The Home Valuation Report is an in-depth analysis detailing your home's value as well as a comparison with similar homes in the area
Home Values in the Area
Average Home Value in this Area
Purchase History
| Date | Buyer | Sale Price | Title Company |
|---|---|---|---|
| Wasylk Jasmine | $507,000 | Liberty Title | |
| Knope Charlene A | -- | None Available | |
| Knope Charlene Ann | -- | None Available | |
| Philion Diane Lee | $95,000 | -- | |
| Tcf National Bank | -- | -- |
Source: Public Records
Mortgage History
| Date | Status | Borrower | Loan Amount |
|---|---|---|---|
| Open | Wasylk Jasmine | $497,816 |
Source: Public Records
Tax History
| Year | Tax Paid | Tax Assessment Tax Assessment Total Assessment is a certain percentage of the fair market value that is determined by local assessors to be the total taxable value of land and additions on the property. | Land | Improvement |
|---|---|---|---|---|
| 2025 | $5,109 | $231,700 | $0 | $0 |
| 2024 | $4,967 | $232,700 | $0 | $0 |
| 2023 | $4,728 | $208,700 | $0 | $0 |
| 2022 | $5,913 | $171,500 | $0 | $0 |
| 2021 | $5,801 | $165,600 | $0 | $0 |
| 2020 | $5,770 | $164,600 | $0 | $0 |
| 2019 | $5,715 | $171,500 | $0 | $0 |
| 2018 | $5,139 | $143,900 | $0 | $0 |
| 2017 | $5,042 | $145,600 | $0 | $0 |
| 2016 | $5,005 | $128,000 | $0 | $0 |
| 2014 | $3,875 | $108,880 | $0 | $0 |
| 2012 | $3,875 | $94,400 | $0 | $0 |
Source: Public Records
Map
Nearby Homes
- 521 Carberry Hill
- 119 Pondview Ct Unit 9
- 4125 Flint Rd
- 660 Flint Rd
- 594 Anne Ave
- 584 Anne Ave
- 224 Sean St
- 605 Jenny Way Unit 12
- 8719 Meadowbrook Dr Unit 5
- 8741 Green Willow St Unit 11
- 8709 Candlewood Trail Unit 5
- 4378 Deeside Dr
- 0 Ben Hur Dr
- 525 Walnut St
- 523 Walnut St
- 302 N 2nd St Unit 5
- Northpointe Northpointe Ridge
- 109 S 2nd St Unit 17
- 3894 Chatham Place
- 3894 Chatham Place Unit 98
- 4613 Spring Mountain Dr
- 4601 Spring Mountain Dr
- 4601 Spring Mountain Dr Unit 20
- 4595 Spring Mountain Dr
- 4619 Spring Mountain Dr
- 4604 Spring Mountain Dr
- 4610 Spring Mountain Dr
- 4610 Spring Mountain Dr Unit 10
- 4598 Spring Mountain Dr
- 4589 Spring Mountain Dr
- 4625 Spring Mountain Dr
- 4616 Spring Mountain Dr
- 4592 Spring Mountain Dr
- 4622 Spring Mountain Dr
- 4586 Spring Mountain Dr
- 4588 Reserve Way
- 4594 Reserve Way
- 4596 Reserve Way
- 4587 Reserve Way
- 4590 Reserve Way
Your Personal Tour Guide
Ask me questions while you tour the home.