46077 Tallgrass Ct Unit Bldg-Unit Belleville, MI 48111
Estimated Value: $160,000 - $165,000
2
Beds
2
Baths
1,075
Sq Ft
$152/Sq Ft
Est. Value
About This Home
This home is located at 46077 Tallgrass Ct Unit Bldg-Unit, Belleville, MI 48111 and is currently estimated at $163,142, approximately $151 per square foot. 46077 Tallgrass Ct Unit Bldg-Unit is a home located in Wayne County with nearby schools including Heber Hunt Elementary School, Horace Mann Elementary School, and Owen Intermediate School.
Ownership History
Date
Name
Owned For
Owner Type
Purchase Details
Closed on
Jan 5, 2018
Sold by
Zhai Rui
Bought by
Wonner Matthew E
Current Estimated Value
Purchase Details
Closed on
Jul 22, 2016
Sold by
Baum Tina and Baum Tima M
Bought by
Zhai Rui
Purchase Details
Closed on
May 8, 2008
Sold by
Thompson Reginald P and Mortgage Electronic Registrati
Bought by
Gmac Mortgage Llc
Purchase Details
Closed on
Oct 16, 2001
Sold by
Cal 1
Bought by
Thompson Reginald P
Create a Home Valuation Report for This Property
The Home Valuation Report is an in-depth analysis detailing your home's value as well as a comparison with similar homes in the area
Home Values in the Area
Average Home Value in this Area
Purchase History
| Date | Buyer | Sale Price | Title Company |
|---|---|---|---|
| Wonner Matthew E | $88,000 | Michigan Title Ins Agency In | |
| Zhai Rui | $77,000 | Title One Inc | |
| Gmac Mortgage Llc | $75,000 | None Available | |
| Thompson Reginald P | $100,150 | -- |
Source: Public Records
Tax History Compared to Growth
Tax History
| Year | Tax Paid | Tax Assessment Tax Assessment Total Assessment is a certain percentage of the fair market value that is determined by local assessors to be the total taxable value of land and additions on the property. | Land | Improvement |
|---|---|---|---|---|
| 2025 | $1,016 | $72,500 | $0 | $0 |
| 2024 | $1,016 | $65,700 | $0 | $0 |
| 2023 | $969 | $58,000 | $0 | $0 |
| 2022 | $1,645 | $52,600 | $0 | $0 |
| 2021 | $1,616 | $46,400 | $0 | $0 |
| 2020 | $1,597 | $44,100 | $0 | $0 |
| 2019 | $1,505 | $41,500 | $0 | $0 |
| 2018 | $709 | $38,400 | $0 | $0 |
| 2017 | $1,311 | $37,000 | $0 | $0 |
| 2016 | $679 | $35,400 | $0 | $0 |
| 2015 | $2,085 | $29,200 | $0 | $0 |
| 2013 | $2,020 | $20,200 | $0 | $0 |
| 2010 | -- | $30,400 | $0 | $0 |
Source: Public Records
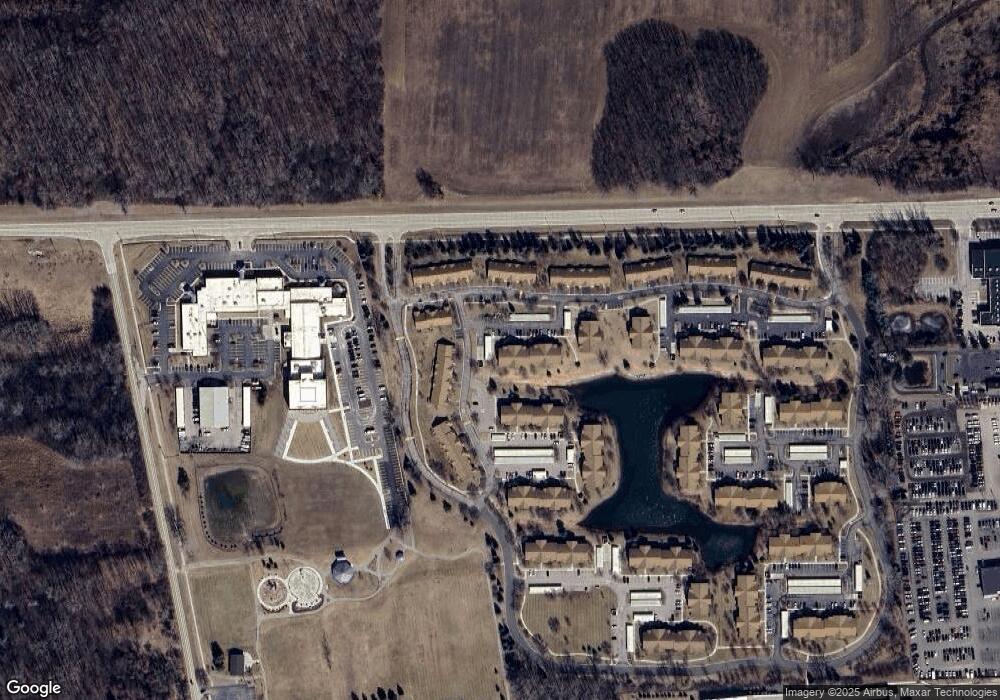
Map
Nearby Homes
- 46158 Reedgrass Ln Unit 4
- 44043 Tyler Rd
- 45905 Wildrye Ct Unit 2
- 45762 Prairiegrass Ct Unit 7
- 6555 Bristol Dr
- 44804 Tyler Rd
- 45955 Ecorse Rd
- 8676 W Walden Dr
- 7585 Belleville Rd
- 7837 Mida Dr
- 45109 Interstate 94 S Service Dr
- 9639 Hampton Dr
- 6579 Chandler Dr
- 11558 Rickman Dr
- 44994 Sondra Dr Unit 42
- 43891 Interstate 94 S Service Dr
- 6785 Belleville Rd
- 47298 Denton Rd
- 43300 N Interstate 94 Service Dr
- 8784 Ironwood Dr Unit 70
- 46077 Tallgrass Ct Unit 90
- 46073 Tallgrass Ct Unit 88
- 46069 Tallgrass Ct
- 46069 Tallgrass Ct Unit 4
- 46063 Tallgrass Ct Unit 84
- 46049 Tallgrass Ct
- 46047 Tallgrass Ct Unit 82
- 46144 Reedgrass Ln Unit Bldg-Unit
- 46144 Reedgrass Ln Unit 5
- 46070 Reedgrass Ln
- 46122 Reedgrass Ln
- 46096 Reedgrass Ln Unit 7
- 46079 Tallgrass Ct Unit 16, 8
- 46079 Tallgrass Ct
- 46079 Tallgrass Ct Unit 91
- 46079 Tallgrass Ct Unit 8
- 46048 Reedgrass Ln Unit 9
- 45963 Tallgrass Ct
- 45963 Tallgrass Ct Unit 1
- 46067 Tallgrass Ct Unit 3