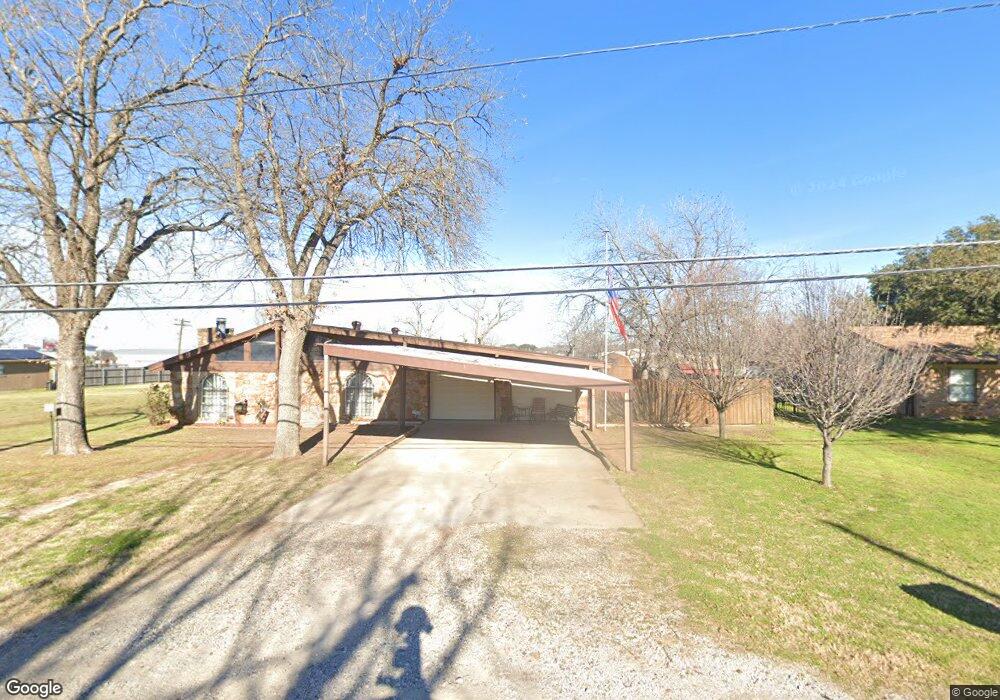
4608 Francis Ct Granbury, TX 76049
Estimated Value: $217,872 - $277,000
3
Beds
2
Baths
1,456
Sq Ft
$172/Sq Ft
Est. Value
About This Home
This home is located at 4608 Francis Ct, Granbury, TX 76049 and is currently estimated at $250,718, approximately $172 per square foot. 4608 Francis Ct is a home located in Hood County with nearby schools including Acton Elementary School, Acton Middle School, and Granbury High School.
Ownership History
Date
Name
Owned For
Owner Type
Purchase Details
Closed on
Sep 12, 2025
Sold by
Mckinley Melba Dianne and Mckinley Dianne M
Bought by
Mckinley Melba Dianne
Current Estimated Value
Home Financials for this Owner
Home Financials are based on the most recent Mortgage that was taken out on this home.
Original Mortgage
$330,000
Outstanding Balance
$330,000
Interest Rate
6.58%
Mortgage Type
Credit Line Revolving
Estimated Equity
-$79,282
Purchase Details
Closed on
Feb 28, 2014
Sold by
Mckinley Jack K
Bought by
Mckinley Melba Dianne
Purchase Details
Closed on
Jun 15, 2005
Sold by
Hastings Harold L
Bought by
Mckinley Jack K and Mckinley Dianne M
Home Financials for this Owner
Home Financials are based on the most recent Mortgage that was taken out on this home.
Original Mortgage
$71,462
Interest Rate
5.76%
Mortgage Type
Purchase Money Mortgage
Purchase Details
Closed on
Jun 10, 2003
Sold by
Hastings Harold L
Bought by
Mckinley Melba Dianne
Purchase Details
Closed on
Jan 30, 2001
Sold by
Hastings Tommie
Bought by
Mckinley Melba Dianne
Create a Home Valuation Report for This Property
The Home Valuation Report is an in-depth analysis detailing your home's value as well as a comparison with similar homes in the area
Home Values in the Area
Average Home Value in this Area
Purchase History
| Date | Buyer | Sale Price | Title Company |
|---|---|---|---|
| Mckinley Melba Dianne | -- | Stewart Title | |
| Mckinley Melba Dianne | -- | -- | |
| Mckinley Jack K | -- | None Available | |
| Mckinley Melba Dianne | -- | -- | |
| Mckinley Melba Dianne | -- | -- |
Source: Public Records
Mortgage History
| Date | Status | Borrower | Loan Amount |
|---|---|---|---|
| Open | Mckinley Melba Dianne | $330,000 | |
| Previous Owner | Mckinley Jack K | $71,462 |
Source: Public Records
Tax History Compared to Growth
Tax History
| Year | Tax Paid | Tax Assessment Tax Assessment Total Assessment is a certain percentage of the fair market value that is determined by local assessors to be the total taxable value of land and additions on the property. | Land | Improvement |
|---|---|---|---|---|
| 2025 | $197 | $158,062 | $24,000 | $136,200 |
| 2024 | $197 | $143,693 | $24,000 | $141,160 |
| 2023 | $1,590 | $167,640 | $24,000 | $143,640 |
| 2022 | $713 | $160,040 | $12,000 | $148,040 |
| 2021 | $1,657 | $107,960 | $6,000 | $101,960 |
| 2020 | $1,621 | $106,820 | $6,000 | $100,820 |
| 2019 | $1,542 | $113,300 | $6,000 | $107,300 |
| 2018 | $1,402 | $86,250 | $6,000 | $80,250 |
| 2017 | $1,423 | $86,660 | $6,000 | $80,660 |
| 2016 | $1,294 | $77,380 | $6,000 | $71,380 |
| 2015 | $1,267 | $75,810 | $6,000 | $69,810 |
| 2014 | $1,267 | $101,800 | $6,000 | $95,800 |
Source: Public Records
Map
Nearby Homes
- 310 East Rd
- 401 East Rd
- 309 Lilac Dr
- 313 Donna Cir
- 3517 Bravery Rd
- 2019 Lindale Ln
- 2061 Lindale Ln
- 3008 Lucky Pepper Dr
- 2300 Candlestick Dr
- 3612 Lucky Pepper Dr
- 3609 Lucky Pepper Dr
- 2500 Tom Chaney
- 306 Kathy Ln
- 1804 Ruffian Rd
- 210 Donna Cir
- 4406 Bobbie Ann Dr
- 4404 Bobbie Ann Dr
- 1829 Ruffian Rd
- 134 Donna Cir
- 1936 Preakness Dr
- 4610 Francis Ct
- 4604 Francis Ct
- 4612 Francis Ct
- 4607 Francis Ct
- 4605 Francis Ct
- 4609 Francis Ct
- 4602 Francis Ct
- 4603 Francis Ct
- 4521 E Us Highway 377
- 4521 E Highway 377
- 4515 E Us Highway 377
- 4614 Pecan Ln
- 4615 Francis Ct
- 4609 Pecan Ln
- 4525 E Us Highway 377
- 4611 Pecan Ln
- 4605 Pecan Ln
- 300 Daisy Dr
- 4601 Pecan Ln
- 4425 E Us Highway 377