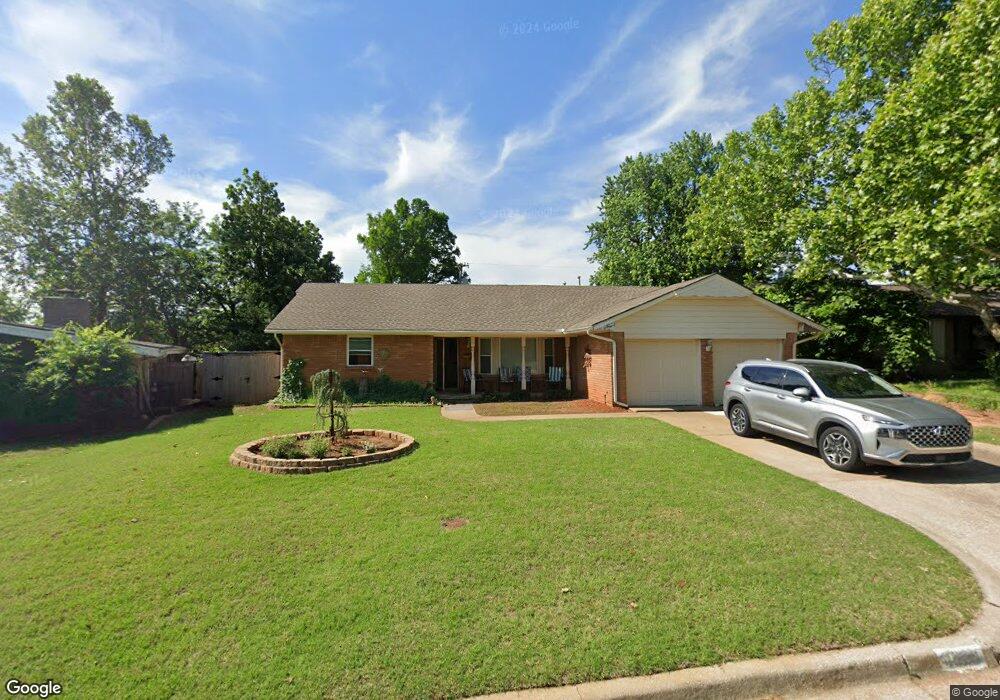
4608 NW 59th Terrace Oklahoma City, OK 73122
Rollingwood NeighborhoodEstimated Value: $187,000 - $205,000
3
Beds
2
Baths
1,587
Sq Ft
$124/Sq Ft
Est. Value
About This Home
This home is located at 4608 NW 59th Terrace, Oklahoma City, OK 73122 and is currently estimated at $196,923, approximately $124 per square foot. 4608 NW 59th Terrace is a home located in Oklahoma County with nearby schools including Rollingwood Elementary School, James L. Capps Middle School, and Putnam City High School.
Ownership History
Date
Name
Owned For
Owner Type
Purchase Details
Closed on
Dec 3, 2024
Sold by
Merrill E Scott Living Trust and Scott Merrill E
Bought by
Merrill E Scott Jr Living Trust and Scott
Current Estimated Value
Purchase Details
Closed on
Oct 11, 2024
Sold by
Scott Merrill E
Bought by
Merrill E Scott Living Trust and Scott
Purchase Details
Closed on
Oct 10, 2017
Sold by
Cut Rate Property Llc
Bought by
Scott Merrill
Home Financials for this Owner
Home Financials are based on the most recent Mortgage that was taken out on this home.
Original Mortgage
$20,000
Interest Rate
3.85%
Purchase Details
Closed on
May 9, 2007
Sold by
Scott Merrill L and Scott Sherri M
Bought by
Scott Merrill E
Purchase Details
Closed on
Nov 24, 2003
Sold by
Erisman Blair
Bought by
Scott Merrill E and Scott Sherri M
Create a Home Valuation Report for This Property
The Home Valuation Report is an in-depth analysis detailing your home's value as well as a comparison with similar homes in the area
Home Values in the Area
Average Home Value in this Area
Purchase History
| Date | Buyer | Sale Price | Title Company |
|---|---|---|---|
| Merrill E Scott Jr Living Trust | -- | None Listed On Document | |
| Merrill E Scott Living Trust | -- | None Listed On Document | |
| Scott Merrill | -- | -- | |
| Scott Merrill E | -- | None Available | |
| Scott Merrill E | $80,000 | Stewart Abstract & Title Of |
Source: Public Records
Mortgage History
| Date | Status | Borrower | Loan Amount |
|---|---|---|---|
| Previous Owner | Scott Merrill | $20,000 | |
| Previous Owner | Scott Merrill | -- |
Source: Public Records
Tax History Compared to Growth
Tax History
| Year | Tax Paid | Tax Assessment Tax Assessment Total Assessment is a certain percentage of the fair market value that is determined by local assessors to be the total taxable value of land and additions on the property. | Land | Improvement |
|---|---|---|---|---|
| 2024 | $1,785 | $16,116 | $3,100 | $13,016 |
| 2023 | $1,785 | $15,646 | $2,227 | $13,419 |
| 2022 | $1,751 | $15,190 | $2,457 | $12,733 |
| 2021 | $1,680 | $14,748 | $2,763 | $11,985 |
| 2020 | $1,621 | $14,319 | $2,880 | $11,439 |
| 2019 | $1,546 | $13,902 | $2,578 | $11,324 |
| 2018 | $1,500 | $13,497 | $0 | $0 |
| 2017 | $1,455 | $13,103 | $2,557 | $10,546 |
| 2016 | $1,407 | $12,722 | $2,609 | $10,113 |
| 2015 | $1,379 | $12,352 | $2,695 | $9,657 |
| 2014 | $1,342 | $12,484 | $2,695 | $9,789 |
Source: Public Records
Map
Nearby Homes
- 4632 NW 60th St
- 4612 NW 62nd St
- 6309 NW 62nd Cir
- 5800 N Meridian Place
- 6308 NW 62nd Cir
- 5714 N Meridian Ave
- 4401 NW 60th St
- 4405 NW 59th St
- 4320 NW 61st Terrace
- 6200 N Warren Ave
- 4412 NW 57th St
- 4312 NW 59th St
- 6425 N Harvard Ave
- 4221 NW 60th Place
- 4312 NW 56th Terrace
- 4333 NW 55th St
- 4219 NW 58th St
- 6554 N Meridian Ave Unit 210
- 4406 NW 54th St
- 4124 NW 61st Terrace
- 4612 NW 59th Terrace
- 4604 NW 59th Terrace
- 5913 N Harvard Ave
- 5917 N Harvard Ave
- 4601 NW 59th St
- 4616 NW 59th Terrace
- 4605 NW 59th St
- 4600 NW 59th Terrace
- 4617 NW 59th Terrace
- 4613 NW 59th Terrace
- 4621 NW 59th Terrace
- 4609 NW 59th St
- 4620 NW 59th Terrace
- 4609 NW 59th Terrace
- 4625 NW 59th Terrace
- 4613 NW 59th St
- 4629 NW 59th Terrace
- 4605 NW 59th Terrace
- 4624 NW 59th Terrace
- 4600 NW 59th St