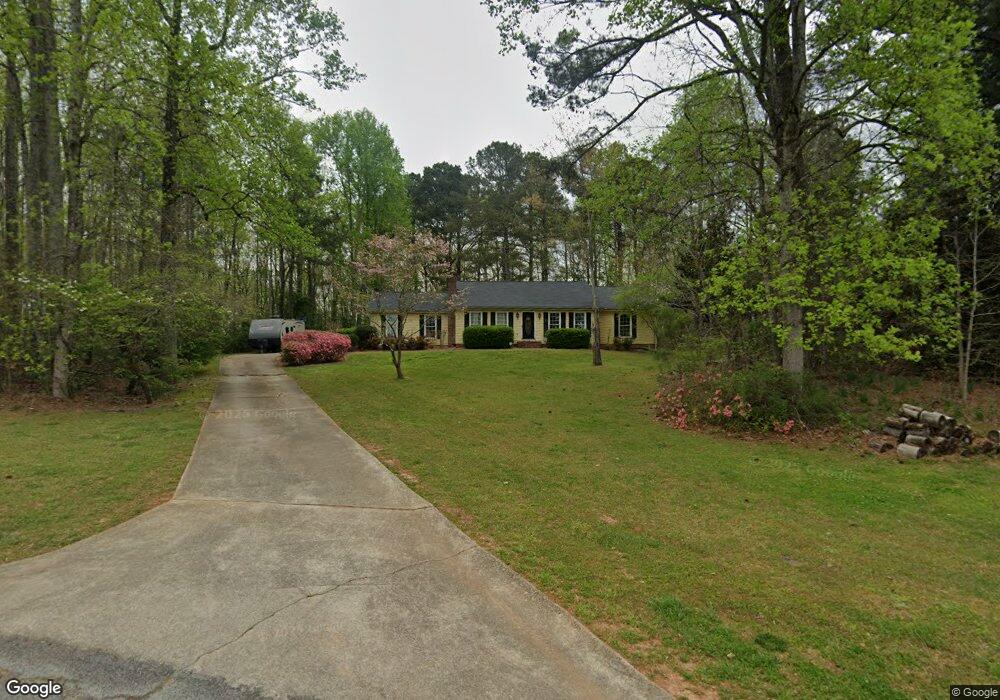
4608 Steeplechase Ln Flowery Branch, GA 30542
Estimated Value: $312,000 - $336,000
3
Beds
2
Baths
1,532
Sq Ft
$210/Sq Ft
Est. Value
About This Home
This home is located at 4608 Steeplechase Ln, Flowery Branch, GA 30542 and is currently estimated at $321,192, approximately $209 per square foot. 4608 Steeplechase Ln is a home located in Hall County with nearby schools including Martin Elementary School, Southwest Middle School, and C.W. Davis Middle School.
Ownership History
Date
Name
Owned For
Owner Type
Purchase Details
Closed on
Jul 14, 2015
Sold by
Foster Brian
Bought by
Foster Shanyn M
Current Estimated Value
Purchase Details
Closed on
May 30, 2008
Sold by
Honeycutt Travis W
Bought by
Foster Brian W and Foster Shanyn M
Home Financials for this Owner
Home Financials are based on the most recent Mortgage that was taken out on this home.
Original Mortgage
$132,914
Interest Rate
6.02%
Mortgage Type
FHA
Purchase Details
Closed on
Nov 22, 2004
Sold by
Callas Linda
Bought by
Honeycutt Travis W
Home Financials for this Owner
Home Financials are based on the most recent Mortgage that was taken out on this home.
Original Mortgage
$116,000
Interest Rate
5.66%
Mortgage Type
New Conventional
Purchase Details
Closed on
Feb 28, 2001
Sold by
English D Brian
Bought by
Callas Linda
Purchase Details
Closed on
Jan 17, 1997
Sold by
Lester Keith Marie
Bought by
English Brian Edith
Purchase Details
Closed on
Jul 1, 1996
Create a Home Valuation Report for This Property
The Home Valuation Report is an in-depth analysis detailing your home's value as well as a comparison with similar homes in the area
Home Values in the Area
Average Home Value in this Area
Purchase History
| Date | Buyer | Sale Price | Title Company |
|---|---|---|---|
| Foster Shanyn M | -- | -- | |
| Foster Brian W | $135,000 | -- | |
| Honeycutt Travis W | $145,000 | -- | |
| Callas Linda | $135,000 | -- | |
| English Brian Edith | $97,000 | -- | |
| -- | $73,500 | -- |
Source: Public Records
Mortgage History
| Date | Status | Borrower | Loan Amount |
|---|---|---|---|
| Previous Owner | Foster Brian W | $132,914 | |
| Previous Owner | Honeycutt Travis W | $116,000 | |
| Closed | English Brian Edith | $0 |
Source: Public Records
Tax History Compared to Growth
Tax History
| Year | Tax Paid | Tax Assessment Tax Assessment Total Assessment is a certain percentage of the fair market value that is determined by local assessors to be the total taxable value of land and additions on the property. | Land | Improvement |
|---|---|---|---|---|
| 2024 | $2,734 | $109,720 | $14,360 | $95,360 |
| 2023 | $2,711 | $104,400 | $14,360 | $90,040 |
| 2022 | $2,260 | $86,880 | $14,360 | $72,520 |
| 2021 | $2,119 | $79,960 | $14,360 | $65,600 |
| 2020 | $1,738 | $63,600 | $7,880 | $55,720 |
| 2019 | $1,747 | $63,400 | $7,680 | $55,720 |
| 2018 | $1,603 | $56,280 | $7,680 | $48,600 |
| 2017 | $1,279 | $45,239 | $7,680 | $37,559 |
| 2016 | $1,250 | $45,239 | $7,680 | $37,559 |
| 2015 | $1,259 | $45,239 | $7,680 | $37,559 |
| 2014 | $1,259 | $45,239 | $7,680 | $37,559 |
Source: Public Records
Map
Nearby Homes
- 4643 Wilderness Trail
- 4712 Wilderness Trail
- 4446 Union Church Rd
- 4704 Wilderness Trail
- 4695 Wilderness Trail
- 4715 Wilderness Trail
- 5055 Pointer Ridge
- 5061 Pointer Ridge
- 4621 Stanley Rd
- 4559 Winder Hwy
- 4860 Wildlife Way
- 4577 Winder Hwy
- 5049 Holly Hock Dr
- 4743 Amsterdam Ln
- 4998 Planters Way
- 4835 Upper Berkshire Rd
- 4626 Deer Creek Ct
- 4602 Steeplechase Ln
- 4538 Union Church Rd
- 4534 Union Church Rd
- 4529 Nohl Crest Dr
- 4620 Steeplechase Ln
- 4528 Union Church Rd
- 4664. Wilderness Trail
- 4528 Nohl Crest Dr
- 4525 Nohl Crest Dr
- 4619 Steeplechase Ln
- 4524 Union Church Rd
- 4543 Union Church Rd
- 4518 Union Church Rd
- 4521 Nohl Crest Dr
- 4524 Nohl Crest Dr
- 4715 Gateway Ln Unit 1
- 4514 Union Church Rd
- 4517 Nohl Crest Dr
- 4520 Nohl Crest Dr
- 4510 Union Church Rd