Estimated Value: $317,000 - $340,000
3
Beds
2
Baths
1,074
Sq Ft
$307/Sq Ft
Est. Value
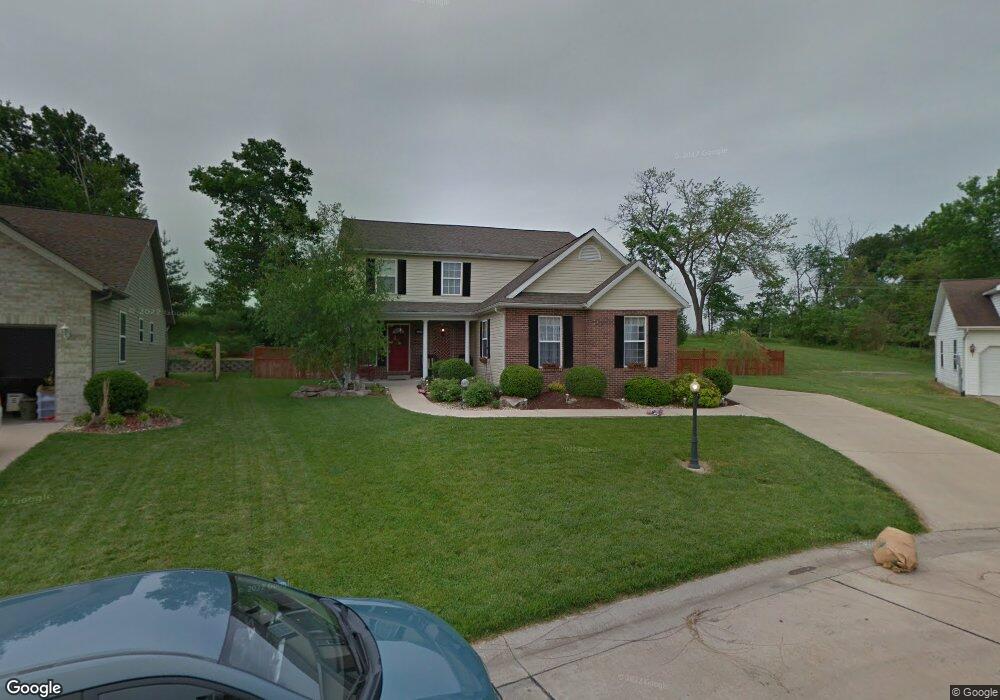
About This Home
This home is located at 4609 Camellia Place, Alton, IL 62002 and is currently estimated at $329,629, approximately $306 per square foot. 4609 Camellia Place is a home located in Madison County with nearby schools including Eunice Smith Elementary School, Alton Middle School, and Alton High School.
Ownership History
Date
Name
Owned For
Owner Type
Purchase Details
Closed on
Apr 14, 2025
Sold by
Noble Paul and Geisen Christina
Bought by
Petersen Todd J
Current Estimated Value
Home Financials for this Owner
Home Financials are based on the most recent Mortgage that was taken out on this home.
Original Mortgage
$330,000
Outstanding Balance
$328,530
Interest Rate
6.63%
Mortgage Type
VA
Estimated Equity
$1,100
Purchase Details
Closed on
Jun 30, 2021
Sold by
Powell Michael and Powell Tammera
Bought by
Noble Paul M
Home Financials for this Owner
Home Financials are based on the most recent Mortgage that was taken out on this home.
Original Mortgage
$190,069
Interest Rate
2.75%
Mortgage Type
FHA
Purchase Details
Closed on
Oct 29, 2008
Sold by
Meridian Land Co
Bought by
Powell Michael and Powell Tammera
Home Financials for this Owner
Home Financials are based on the most recent Mortgage that was taken out on this home.
Original Mortgage
$198,336
Interest Rate
6.11%
Mortgage Type
VA
Create a Home Valuation Report for This Property
The Home Valuation Report is an in-depth analysis detailing your home's value as well as a comparison with similar homes in the area
Home Values in the Area
Average Home Value in this Area
Purchase History
| Date | Buyer | Sale Price | Title Company |
|---|---|---|---|
| Petersen Todd J | $330,000 | Tri County Title & Escrow | |
| Noble Paul M | $234,000 | Serenity Title & Escrow | |
| Powell Michael | $192,000 | Premier Title & Escrow Co |
Source: Public Records
Mortgage History
| Date | Status | Borrower | Loan Amount |
|---|---|---|---|
| Open | Petersen Todd J | $330,000 | |
| Previous Owner | Noble Paul M | $190,069 | |
| Previous Owner | Powell Michael | $198,336 |
Source: Public Records
Tax History Compared to Growth
Tax History
| Year | Tax Paid | Tax Assessment Tax Assessment Total Assessment is a certain percentage of the fair market value that is determined by local assessors to be the total taxable value of land and additions on the property. | Land | Improvement |
|---|---|---|---|---|
| 2024 | $6,050 | $95,740 | $14,800 | $80,940 |
| 2023 | $6,050 | $88,380 | $13,660 | $74,720 |
| 2022 | $5,747 | $80,820 | $12,490 | $68,330 |
| 2021 | $3,241 | $74,290 | $11,750 | $62,540 |
| 2020 | $4,798 | $72,690 | $11,500 | $61,190 |
| 2019 | $4,937 | $70,790 | $11,200 | $59,590 |
| 2018 | $4,854 | $67,770 | $10,720 | $57,050 |
| 2017 | $4,783 | $67,770 | $10,720 | $57,050 |
| 2016 | $4,496 | $67,770 | $10,720 | $57,050 |
| 2015 | $4,027 | $65,630 | $10,380 | $55,250 |
| 2014 | $4,027 | $65,630 | $10,380 | $55,250 |
| 2013 | $4,027 | $65,630 | $10,380 | $55,250 |
Source: Public Records
Map
Nearby Homes
- 4803 Azalea Place Unit 1
- 4801 Azalea Place Unit 2
- 4824 Azalea Place Unit 2
- 0 Happy Ct
- 4814 Azalea Place Unit 2
- 4900 Happy Dr
- 2362 Briarcliff Dr
- 4805 Wick Mor Dr
- 2401 Crislisa Dr
- 4407 Thadway Dr
- 0 Humbert Rd Unit MAR25006502
- 0 Humbert Rd Unit MAR25003159
- 4408 Natchez Ln
- 4442 Delta Queen Ln
- 0 Humbert Rd Unit MIS25052876
- 5661 Humbert Rd
- 5667 Humbert Rd
- 109 Windsor Place
- 421 Saint John Dr
- 00 Pine Ridge Lot#52 Dr
- 4609 Camellia Place
- 4611 Camellia Place
- 4613 Camellia Place
- 4607 Camellia Place
- 4607 Camellia Place
- 4606 Camellia Place
- 430 Camellia Place
- 4615 Camellia Place
- 4608 Camellia Place
- 4610 Camellia Place
- 4617 Camellia Place
- 4616 Camellia Place
- 4619 Camellia Place
- 4618 Camellia Place
- 4608 Wisteria Dr
- 4609 Wisteria Dr
- 4620 Camellia Place
- 4621 Camellia Place
- 4611 Wisteria Dr
- 4622 Camellia Place