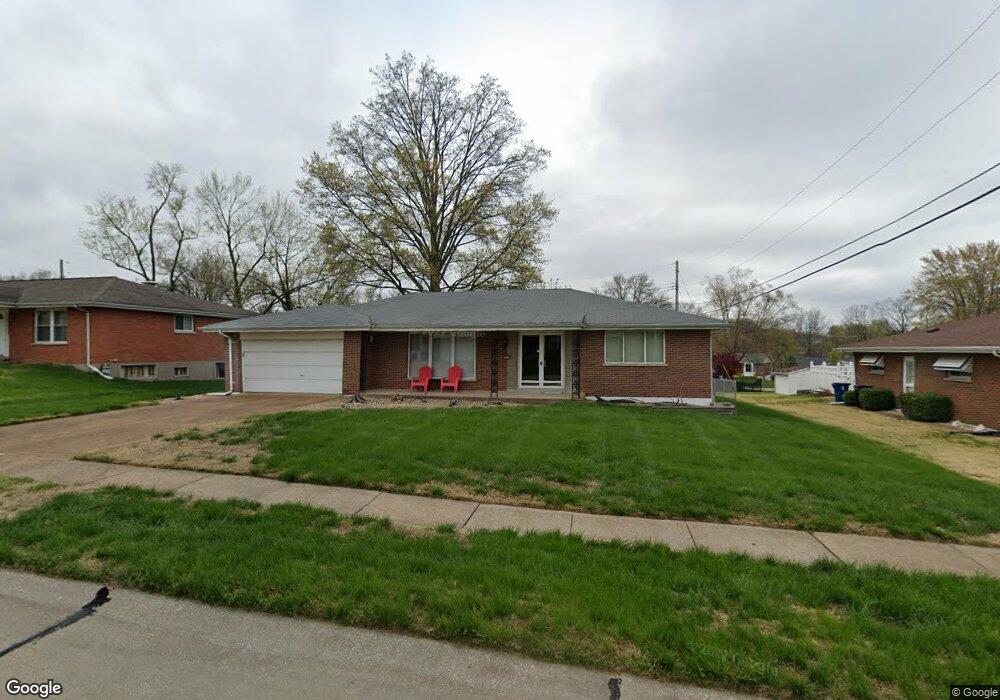
4609 Mooncrest Dr Saint Louis, MO 63128
Estimated Value: $336,000 - $374,000
3
Beds
3
Baths
1,650
Sq Ft
$212/Sq Ft
Est. Value
About This Home
This home is located at 4609 Mooncrest Dr, Saint Louis, MO 63128 and is currently estimated at $350,006, approximately $212 per square foot. 4609 Mooncrest Dr is a home located in St. Louis County with nearby schools including Kennerly Elementary School, Sperreng Middle School, and Lindbergh High School.
Ownership History
Date
Name
Owned For
Owner Type
Purchase Details
Closed on
Nov 28, 2023
Sold by
Ryterski Mark J and Ryterski Deborah J
Bought by
Mark Joseph Ryterski and Mark Deborah Jean
Current Estimated Value
Purchase Details
Closed on
Feb 15, 2007
Sold by
Ryterski Mark J
Bought by
Ryterski Mark J and Ryterski Debi
Create a Home Valuation Report for This Property
The Home Valuation Report is an in-depth analysis detailing your home's value as well as a comparison with similar homes in the area
Home Values in the Area
Average Home Value in this Area
Purchase History
| Date | Buyer | Sale Price | Title Company |
|---|---|---|---|
| Mark Joseph Ryterski | -- | None Listed On Document | |
| Ryterski Mark J | -- | None Listed On Document | |
| Ryterski Mark J | -- | None Available |
Source: Public Records
Tax History Compared to Growth
Tax History
| Year | Tax Paid | Tax Assessment Tax Assessment Total Assessment is a certain percentage of the fair market value that is determined by local assessors to be the total taxable value of land and additions on the property. | Land | Improvement |
|---|---|---|---|---|
| 2025 | $3,567 | $62,930 | $15,680 | $47,250 |
| 2024 | $3,567 | $54,790 | $17,400 | $37,390 |
| 2023 | $3,558 | $54,790 | $17,400 | $37,390 |
| 2022 | $3,244 | $47,910 | $17,400 | $30,510 |
| 2021 | $3,129 | $47,910 | $17,400 | $30,510 |
| 2020 | $2,978 | $43,970 | $15,680 | $28,290 |
| 2019 | $2,970 | $43,970 | $15,680 | $28,290 |
| 2018 | $3,079 | $41,480 | $9,580 | $31,900 |
| 2017 | $3,046 | $41,480 | $9,580 | $31,900 |
| 2016 | $2,569 | $33,170 | $8,720 | $24,450 |
| 2015 | $2,530 | $33,170 | $8,720 | $24,450 |
| 2014 | $2,246 | $29,110 | $5,870 | $23,240 |
Source: Public Records
Map
Nearby Homes
- 4829 Vermilion Dr
- 4700 Theiss Rd
- 4642 Theiss Rd
- 4818 Chapel Hill Dr
- 4449 Pinyon Jay Ct
- 4643 Littlebury Dr
- 4525 Eli Dr Unit D
- 4501 Eli Dr Unit I
- 4740 Hedgemont Dr
- 4931 Theiss Rd
- 4724 Tarlton Dr
- 4849 Gatesbury Dr
- 4838 Dorsie Dr
- 4921 Kerth Rd
- 4334 Arrow Tree Dr Unit L
- 4334 Arrow Tree Dr Unit J
- 4833 Hursley Dr
- 4645 Tauneybrook Dr
- 4839 Hursley Dr
- 25 Fawnwood Dr
- 4617 Mooncrest Dr
- 4601 Mooncrest Dr
- 4540 Valmeyer Dr
- 4552 Valmeyer Dr
- 4621 Mooncrest Dr
- 4610 Mooncrest Dr
- 4602 Mooncrest Dr
- 4616 Mooncrest Dr
- 4568 Valmeyer Dr
- 4564 Mooncrest Dr
- 4511 Valmeyer Dr
- 4622 Mooncrest Dr
- 4574 Valmeyer Dr
- 4521 Valmeyer Dr
- 4527 Valmeyer Dr
- 4533 Valmeyer Dr
- 4556 Mooncrest Dr
- 4531 Gemini Dr
- 4539 Valmeyer Dr
- 4539 Gemini Dr