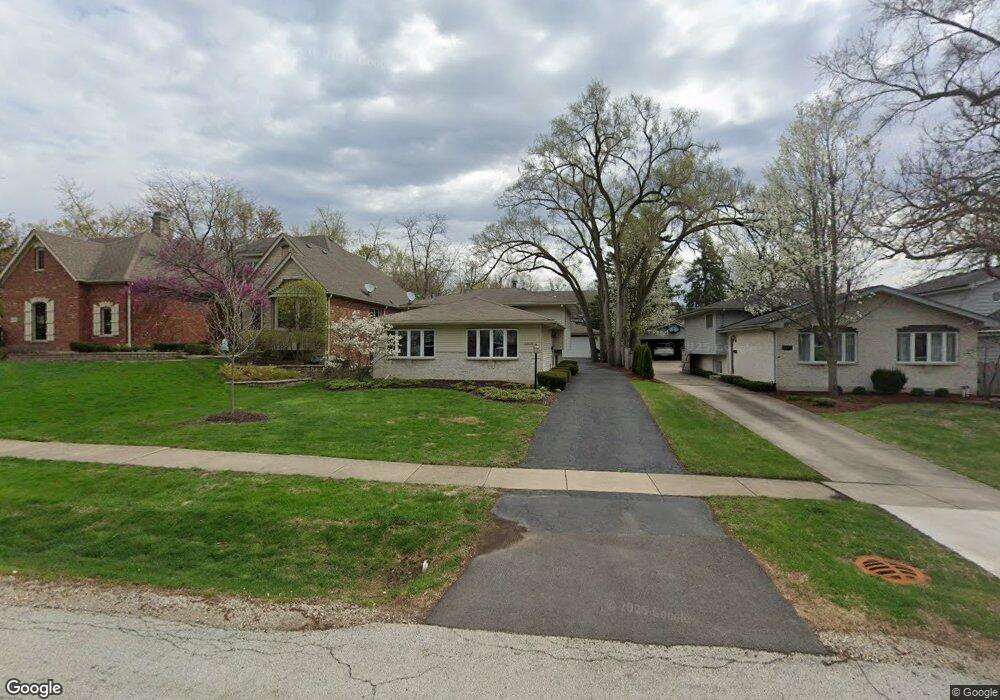
4609 Pershing Ave Downers Grove, IL 60515
Estimated Value: $409,000 - $543,000
3
Beds
2
Baths
1,254
Sq Ft
$376/Sq Ft
Est. Value
About This Home
This home is located at 4609 Pershing Ave, Downers Grove, IL 60515 and is currently estimated at $471,709, approximately $376 per square foot. 4609 Pershing Ave is a home located in DuPage County with nearby schools including Henry Puffer School, Herrick Middle School, and Downer Grove North High School.
Ownership History
Date
Name
Owned For
Owner Type
Purchase Details
Closed on
Aug 15, 2005
Sold by
Jablonski Martin C and Jablonski Dana M
Bought by
Jablonski Martin C and Jablonski Dana M
Current Estimated Value
Purchase Details
Closed on
Apr 7, 2005
Sold by
Roberts Donald M and Roberts Kimberly K
Bought by
Jablosnki Martin C and Piszynski Dana M
Home Financials for this Owner
Home Financials are based on the most recent Mortgage that was taken out on this home.
Original Mortgage
$276,000
Outstanding Balance
$143,443
Interest Rate
5.89%
Mortgage Type
Fannie Mae Freddie Mac
Estimated Equity
$328,266
Create a Home Valuation Report for This Property
The Home Valuation Report is an in-depth analysis detailing your home's value as well as a comparison with similar homes in the area
Home Values in the Area
Average Home Value in this Area
Purchase History
| Date | Buyer | Sale Price | Title Company |
|---|---|---|---|
| Jablonski Martin C | -- | -- | |
| Jablosnki Martin C | $345,000 | Atg |
Source: Public Records
Mortgage History
| Date | Status | Borrower | Loan Amount |
|---|---|---|---|
| Open | Jablosnki Martin C | $276,000 | |
| Closed | Jablosnki Martin C | $34,500 |
Source: Public Records
Tax History Compared to Growth
Tax History
| Year | Tax Paid | Tax Assessment Tax Assessment Total Assessment is a certain percentage of the fair market value that is determined by local assessors to be the total taxable value of land and additions on the property. | Land | Improvement |
|---|---|---|---|---|
| 2024 | $7,755 | $143,603 | $55,136 | $88,467 |
| 2023 | $7,330 | $131,060 | $50,320 | $80,740 |
| 2022 | $7,360 | $131,060 | $50,320 | $80,740 |
| 2021 | $6,708 | $126,110 | $48,420 | $77,690 |
| 2020 | $6,598 | $123,840 | $47,550 | $76,290 |
| 2019 | $6,283 | $118,470 | $45,490 | $72,980 |
| 2018 | $6,036 | $112,510 | $43,200 | $69,310 |
| 2017 | $5,869 | $108,710 | $41,740 | $66,970 |
| 2016 | $5,808 | $104,780 | $40,230 | $64,550 |
| 2015 | $5,746 | $97,370 | $37,880 | $59,490 |
| 2014 | $5,626 | $92,820 | $36,520 | $56,300 |
| 2013 | $5,553 | $93,040 | $36,610 | $56,430 |
Source: Public Records
Map
Nearby Homes
- 4512 Wilson Ave
- 4601 Wilson Ave
- 4508 Stonewall Ave
- 4424 Arbor Cir Unit 3
- 2209 Arbor Cir Unit 5
- 4408 Stonewall Ave
- 4522 Lee Ave
- 4436 Lee Ave
- 4947 Stonewall Ave
- 4940 Cornell Ave
- 4848 Francisco Ave
- 1436 Gilbert Lot 1 Ave
- 4022 Earlston Rd
- 4939 Lee Ave
- 1805 Gilbert Ave
- 4416 Seeley Ave
- 4832 Seeley Ave
- 4014 Morton Ave
- 4140 Seeley Ave
- 4741 Montgomery Ave
- 4605 Pershing Ave
- 4613 Pershing Ave
- 4617 Pershing Ave
- 4608 Wilson Ave
- 4601 Pershing Ave
- 4621 Pershing Ave
- 4612 Wilson Ave
- 4616 Wilson Ave
- 4537 Pershing Ave
- 4625 Pershing Ave
- 4604 Wilson Ave
- 4600 Wilson Ave
- 4616 Pershing Ave
- 4620 Wilson Ave
- 4612 Pershing Ave
- 4608 Pershing Ave
- 4533 Pershing Ave
- 4620 Pershing Ave
- 4604 Pershing Ave
- 4629 Pershing Ave