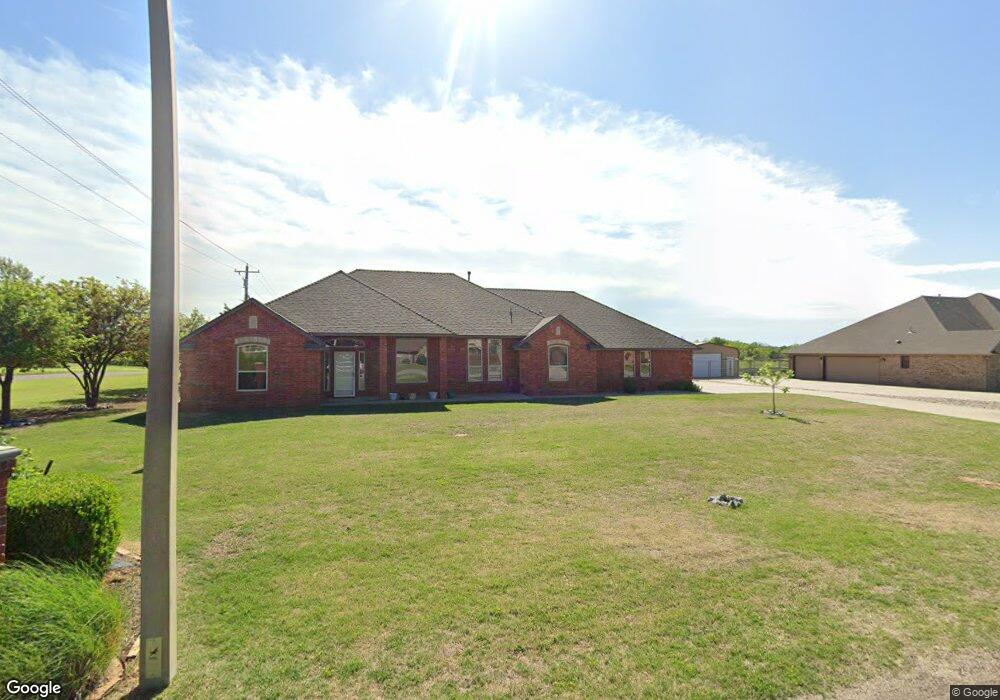
4609 Riverside Dr Tuttle, OK 73089
Estimated Value: $430,000 - $477,000
3
Beds
3
Baths
2,236
Sq Ft
$200/Sq Ft
Est. Value
About This Home
This home is located at 4609 Riverside Dr, Tuttle, OK 73089 and is currently estimated at $446,998, approximately $199 per square foot. 4609 Riverside Dr is a home with nearby schools including Tuttle Elementary School, Tuttle Intermediate School, and Tuttle Middle School.
Ownership History
Date
Name
Owned For
Owner Type
Purchase Details
Closed on
Jun 11, 2010
Sold by
Homes At River Ridge Llc
Bought by
Johnson Terrel L and Johnson Patricia G
Current Estimated Value
Home Financials for this Owner
Home Financials are based on the most recent Mortgage that was taken out on this home.
Original Mortgage
$214,143
Interest Rate
4.87%
Mortgage Type
VA
Purchase Details
Closed on
Apr 6, 2009
Sold by
Sw 29Th Street Steel Inc
Bought by
Homes At River Ridge Llc
Home Financials for this Owner
Home Financials are based on the most recent Mortgage that was taken out on this home.
Original Mortgage
$179,982
Interest Rate
5.24%
Mortgage Type
Unknown
Purchase Details
Closed on
Jan 2, 2008
Sold by
River Ridge Estates Llc
Bought by
S W 29Th Street Steel Inc
Create a Home Valuation Report for This Property
The Home Valuation Report is an in-depth analysis detailing your home's value as well as a comparison with similar homes in the area
Home Values in the Area
Average Home Value in this Area
Purchase History
| Date | Buyer | Sale Price | Title Company |
|---|---|---|---|
| Johnson Terrel L | $235,000 | None Available | |
| Homes At River Ridge Llc | $28,000 | None Available | |
| S W 29Th Street Steel Inc | $28,000 | None Available |
Source: Public Records
Mortgage History
| Date | Status | Borrower | Loan Amount |
|---|---|---|---|
| Previous Owner | Johnson Terrel L | $214,143 | |
| Previous Owner | Homes At River Ridge Llc | $179,982 |
Source: Public Records
Tax History
| Year | Tax Paid | Tax Assessment Tax Assessment Total Assessment is a certain percentage of the fair market value that is determined by local assessors to be the total taxable value of land and additions on the property. | Land | Improvement |
|---|---|---|---|---|
| 2025 | -- | $41,437 | $4,985 | $36,452 |
| 2024 | -- | $40,230 | $4,840 | $35,390 |
| 2023 | $4,102 | $39,058 | $5,109 | $33,949 |
| 2022 | $4,102 | $37,197 | $5,313 | $31,884 |
| 2021 | $4,155 | $35,426 | $5,313 | $30,113 |
| 2020 | $3,801 | $35,712 | $5,313 | $30,399 |
| 2019 | $3,827 | $34,953 | $5,313 | $29,640 |
| 2018 | $0 | $34,429 | $5,236 | $29,193 |
| 2017 | $0 | $32,788 | $4,978 | $27,810 |
| 2016 | $3,374,185 | $31,227 | $3,835 | $27,392 |
| 2015 | -- | $29,740 | $3,045 | $26,695 |
| 2014 | -- | $28,324 | $3,080 | $25,244 |
Source: Public Records
Map
Nearby Homes
- 4606 Shoreside Dr
- 4605 Pikeys Trail
- 4333 Courtlyn Ave
- 1120 Jozie Way
- 1136 Jozie Way
- 1455 Deer Ridge Run
- 1129 Jaden Blvd
- 1137 Jaden Blvd
- 1050 Colonial Ave
- 4435 Violet St
- 1401 Deer Ridge Run
- 1425 Deer Ridge Run
- 1417 Deer Ridge Run
- 1235 Deer Ridge
- 5113 Brooke Rd
- 5441 Bayler Dr
- 5445 Bayler Dr
- 5437 Bayler Dr
- 5405 Daxton Dr
- 408 Labelle Ln
- 4607 Riverside Dr
- 4611 Riverside Dr
- 1721 River Ridge Ln
- 1800 River Ridge Ln
- 4608 Riverside Dr
- 4702 Lake Ridge Ct
- 1802 River Ridge Ln
- 4610 Riverside Dr
- 4606 Riverside Dr
- 1714 Riverview Dr
- 1801 River Ridge Ln
- 4603 Riverside Dr
- 1712 Riverview Dr
- 1710 Riverview Dr
- 1803 River Ridge Ln
- 4604 Riverside Dr
- 1804 River Ridge Ln
- 4706 Lake Ridge Ct
- 1720 Bayside Dr
- 4602 Riverside Dr
Your Personal Tour Guide
Ask me questions while you tour the home.