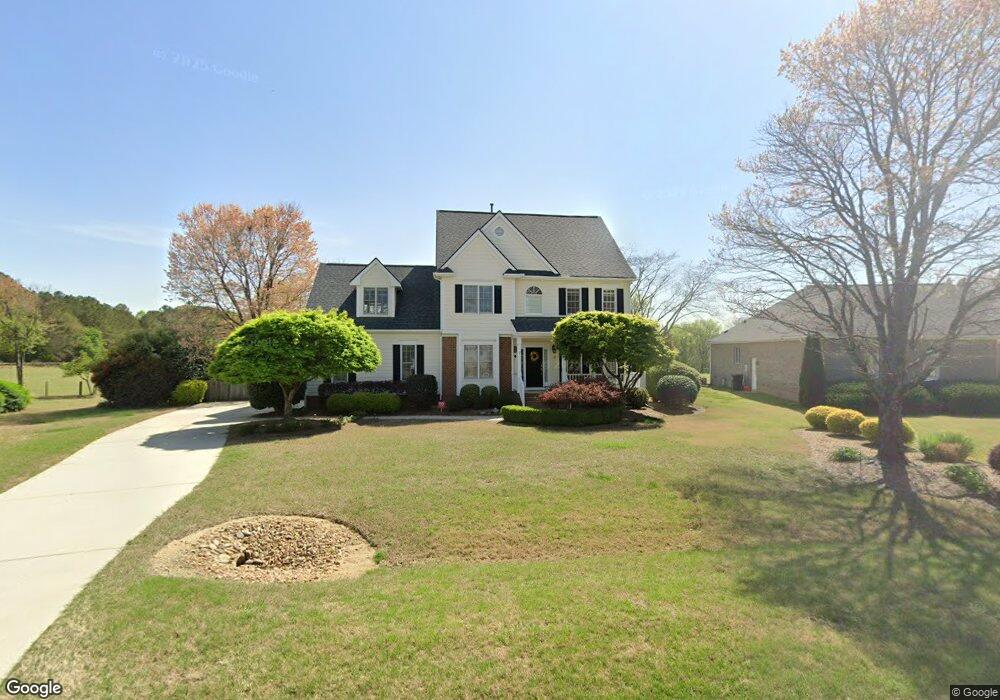
4609 Spring Crest Ct Fuquay Varina, NC 27526
Estimated Value: $600,654 - $714,000
4
Beds
3
Baths
2,900
Sq Ft
$227/Sq Ft
Est. Value
About This Home
This home is located at 4609 Spring Crest Ct, Fuquay Varina, NC 27526 and is currently estimated at $656,914, approximately $226 per square foot. 4609 Spring Crest Ct is a home located in Wake County with nearby schools including Banks Road Elementary School.
Ownership History
Date
Name
Owned For
Owner Type
Purchase Details
Closed on
Jul 16, 2018
Sold by
Zak James D and Zak Kimbelry M
Bought by
Zak Kimberly M
Current Estimated Value
Purchase Details
Closed on
May 3, 2004
Sold by
The Berge Marc W and The Berge Amy E
Bought by
Zak James D and Zak Kimberly M
Home Financials for this Owner
Home Financials are based on the most recent Mortgage that was taken out on this home.
Original Mortgage
$205,000
Outstanding Balance
$96,048
Interest Rate
5.49%
Mortgage Type
New Conventional
Estimated Equity
$560,866
Purchase Details
Closed on
Sep 30, 1999
Sold by
Barrington Homes Inc
Bought by
Theberge Marc W and Theberge Amy E
Home Financials for this Owner
Home Financials are based on the most recent Mortgage that was taken out on this home.
Original Mortgage
$189,900
Interest Rate
7.89%
Create a Home Valuation Report for This Property
The Home Valuation Report is an in-depth analysis detailing your home's value as well as a comparison with similar homes in the area
Home Values in the Area
Average Home Value in this Area
Purchase History
| Date | Buyer | Sale Price | Title Company |
|---|---|---|---|
| Zak Kimberly M | -- | None Available | |
| Zak James D | $315,000 | None Available | |
| Theberge Marc W | $290,000 | -- |
Source: Public Records
Mortgage History
| Date | Status | Borrower | Loan Amount |
|---|---|---|---|
| Open | Zak James D | $205,000 | |
| Previous Owner | Theberge Marc W | $189,900 |
Source: Public Records
Tax History Compared to Growth
Tax History
| Year | Tax Paid | Tax Assessment Tax Assessment Total Assessment is a certain percentage of the fair market value that is determined by local assessors to be the total taxable value of land and additions on the property. | Land | Improvement |
|---|---|---|---|---|
| 2025 | $3,303 | $513,361 | $120,000 | $393,361 |
| 2024 | $3,208 | $513,361 | $120,000 | $393,361 |
| 2023 | $2,721 | $346,389 | $75,000 | $271,389 |
| 2022 | $2,522 | $346,389 | $75,000 | $271,389 |
| 2021 | $2,454 | $346,389 | $75,000 | $271,389 |
| 2020 | $2,414 | $346,389 | $75,000 | $271,389 |
| 2019 | $2,700 | $328,118 | $75,000 | $253,118 |
| 2018 | $2,482 | $328,118 | $75,000 | $253,118 |
| 2017 | $2,353 | $328,118 | $75,000 | $253,118 |
| 2016 | $2,305 | $328,118 | $75,000 | $253,118 |
| 2015 | $2,489 | $355,566 | $90,000 | $265,566 |
| 2014 | -- | $355,566 | $90,000 | $265,566 |
Source: Public Records
Map
Nearby Homes
- 2417 Ridgeford Ct
- 4225 Hilltop Needmore Rd
- 4229 Hilltop Needmore Rd
- 2624 Forestbluff Dr
- 2628 Forestbluff Dr
- 3521 Amelia Grace Dr Unit Lot 67
- 3501 Amelia Grace Dr Unit Lot 71
- 2029 Prairie Ridge Ct
- 3412 Amelia Grace Dr Unit Lot 43
- 2612 Hidden Meadow Dr
- 6028 Spicewood Dr
- 2424 Deermist Way
- 2021 Terri Creek Dr
- 2006 Prairie Ridge Ct
- 5705 Tannibark Ln
- 2633 Bloomsberry Ridge Dr
- 4700 Linaria Ln
- 5401 Greensflag Ln
- 2001 Lilly Brook St
- 6104 Spicewood Dr
- 4613 Spring Crest Ct
- 4605 Spring Crest Ct
- 4612 Spring Crest Ct
- 4601 Spring Crest Ct
- 4608 Spring Crest Ct
- 4616 Spring Crest Ct
- 4600 Spring Crest Ct
- 4604 Spring Crest Ct
- 4620 Spring Crest Ct
- 4533 South Ridge Dr
- 4529 South Ridge Dr
- 4624 Spring Crest Ct
- 4525 South Ridge Dr
- 5733 Brushy Meadows Dr
- 4532 South Ridge Dr
- 5721 Brushy Meadows Dr
- 5737 Brushy Meadows Dr
- 4521 South Ridge Dr
- 5741 Brushy Meadows Dr
- 5717 Brushy Meadows Dr