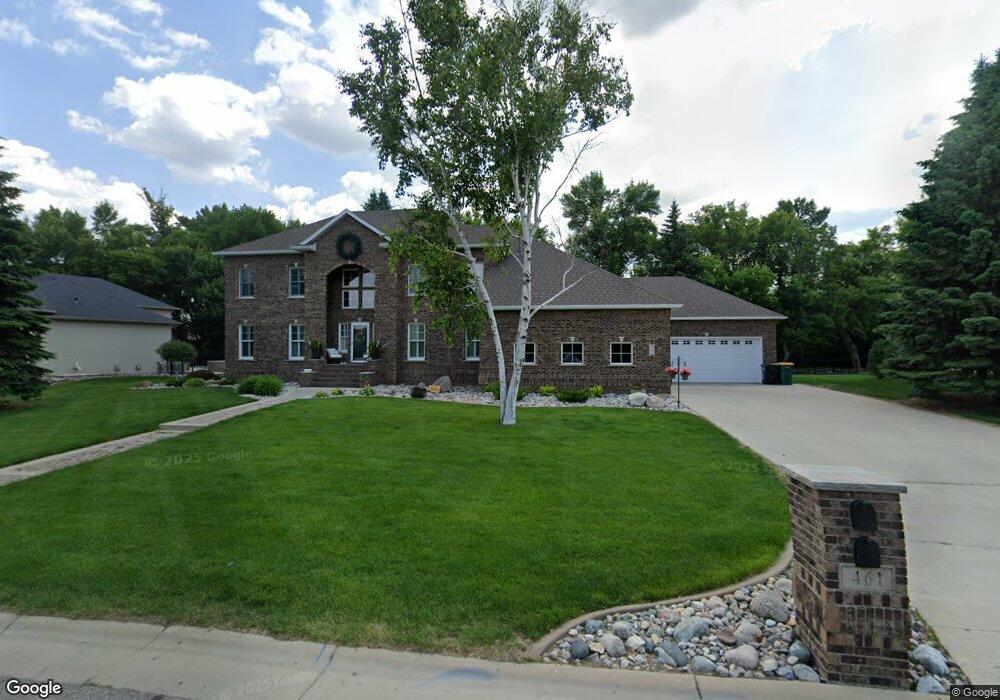
461 20th Ave E West Fargo, ND 58078
Charleswood NeighborhoodEstimated Value: $1,013,728
5
Beds
4
Baths
5,502
Sq Ft
$184/Sq Ft
Est. Value
About This Home
This home is located at 461 20th Ave E, West Fargo, ND 58078 and is currently estimated at $1,013,728, approximately $184 per square foot. 461 20th Ave E is a home located in Cass County with nearby schools including South Elementary School, Cheney Middle School, and West Fargo High School.
Ownership History
Date
Name
Owned For
Owner Type
Purchase Details
Closed on
Jan 21, 2022
Sold by
Dye and Alison
Bought by
Kupitz Jeffrey M and Kupitz Kaley A
Current Estimated Value
Home Financials for this Owner
Home Financials are based on the most recent Mortgage that was taken out on this home.
Original Mortgage
$647,200
Outstanding Balance
$591,571
Interest Rate
3.11%
Mortgage Type
New Conventional
Estimated Equity
$422,157
Purchase Details
Closed on
Sep 30, 2005
Sold by
Crist Loren D and Crist Tamara D
Bought by
Dye Steven and Dye Alison
Home Financials for this Owner
Home Financials are based on the most recent Mortgage that was taken out on this home.
Original Mortgage
$426,400
Interest Rate
5.93%
Mortgage Type
New Conventional
Create a Home Valuation Report for This Property
The Home Valuation Report is an in-depth analysis detailing your home's value as well as a comparison with similar homes in the area
Home Values in the Area
Average Home Value in this Area
Purchase History
| Date | Buyer | Sale Price | Title Company |
|---|---|---|---|
| Kupitz Jeffrey M | $825,000 | Fm Title | |
| Dye Steven | -- | -- |
Source: Public Records
Mortgage History
| Date | Status | Borrower | Loan Amount |
|---|---|---|---|
| Open | Kupitz Jeffrey M | $647,200 | |
| Previous Owner | Dye Steven | $426,400 |
Source: Public Records
Tax History
| Year | Tax Paid | Tax Assessment Tax Assessment Total Assessment is a certain percentage of the fair market value that is determined by local assessors to be the total taxable value of land and additions on the property. | Land | Improvement |
|---|---|---|---|---|
| 2024 | $11,579 | $421,250 | $69,400 | $351,850 |
| 2023 | $11,053 | $398,550 | $69,400 | $329,150 |
| 2022 | $11,881 | $411,900 | $69,400 | $342,500 |
| 2021 | $11,110 | $370,200 | $57,850 | $312,350 |
| 2020 | $10,409 | $356,100 | $57,850 | $298,250 |
| 2019 | $10,498 | $366,500 | $57,850 | $308,650 |
| 2018 | $9,882 | $360,150 | $57,850 | $302,300 |
| 2017 | $9,716 | $363,500 | $57,850 | $305,650 |
| 2016 | $8,549 | $350,700 | $57,850 | $292,850 |
| 2015 | $8,095 | $305,800 | $45,600 | $260,200 |
| 2014 | $7,789 | $285,800 | $45,600 | $240,200 |
| 2013 | $7,606 | $274,350 | $45,600 | $228,750 |
Source: Public Records
Map
Nearby Homes
- 118 W Beaton Dr
- 1929 Pentland St
- 1814 Brentwood Ct
- 412 19th Ave W Unit G
- 1827 7th St E
- 430 19th Ave W Unit A
- 1811 7th St E
- 1550 Sheyenne St
- 715 Northridge Way
- 790 Lakeridge Dr
- 1521 7th St W
- 1011 Barnes Dr W
- 868 Lakeridge Place
- 706 14th Ave E
- 714 14th Ave E
- 1126 Highland Ln W
- 2045 11th St W
- 332 13th Ave E
- 783 14 1 2 Ave E
- 1450 Elmwood Ct
- 469 20th Ave E
- 453 20th Ave E
- 2010 5th St E
- 1927 Princeton Ln
- 437 20th Ave E
- 1919 Princeton Ln
- 1920 Princeton Ln
- 519 Wellington Ct
- 421 20 ave E 20th Ave E
- 124 W Beaton Dr
- 413 20th E
- 527 Wellington Ct
- 122 W Beaton Dr
- 2034 5th St E
- 1911 Princeton Ln
- 429 20th Ave E
- 430 20th Ave E
- 2009 5th St E
- 2017 5th St E
- 130 W Beaton Dr
Your Personal Tour Guide
Ask me questions while you tour the home.