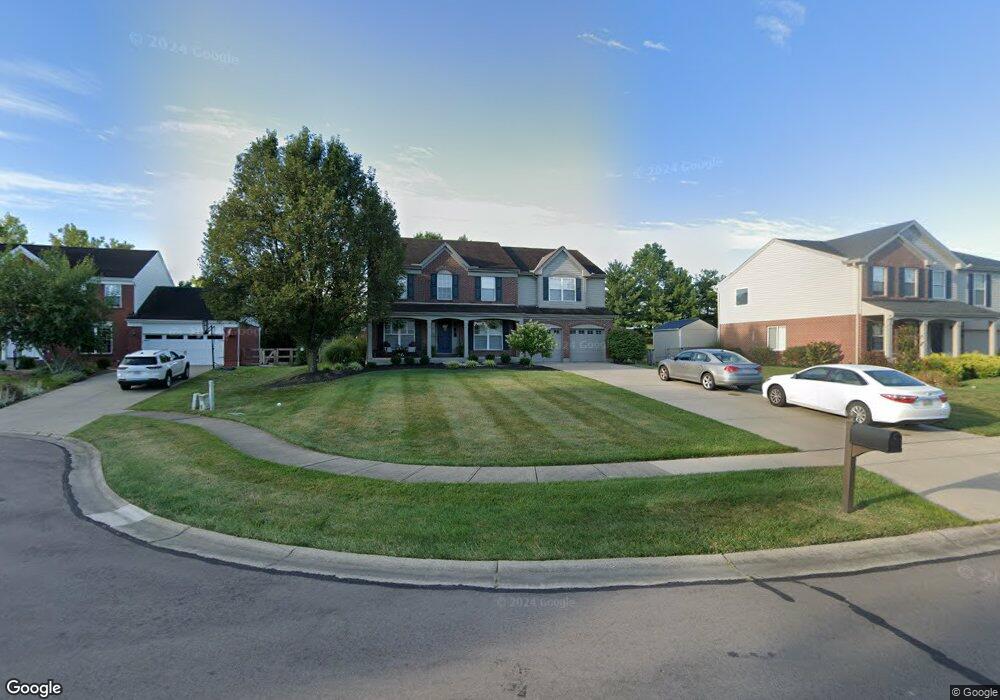
461 Gablefield Ct Cincinnati, OH 45255
Estimated Value: $473,000 - $609,000
4
Beds
3
Baths
2,469
Sq Ft
$210/Sq Ft
Est. Value
About This Home
This home is located at 461 Gablefield Ct, Cincinnati, OH 45255 and is currently estimated at $518,851, approximately $210 per square foot. 461 Gablefield Ct is a home located in Clermont County with nearby schools including Withamsville-Tobasco Elementary School, West Clermont Middle School, and West Clermont High School.
Ownership History
Date
Name
Owned For
Owner Type
Purchase Details
Closed on
Sep 7, 2004
Sold by
Walters Eric J and Mowlai Ashtiani Mahtab
Bought by
Moran Michael E and Moran Theresa G
Current Estimated Value
Home Financials for this Owner
Home Financials are based on the most recent Mortgage that was taken out on this home.
Original Mortgage
$216,750
Interest Rate
2.99%
Mortgage Type
Fannie Mae Freddie Mac
Purchase Details
Closed on
Jan 11, 2001
Sold by
Drees Co
Bought by
Walters Eric J and Walters Ashtiani
Home Financials for this Owner
Home Financials are based on the most recent Mortgage that was taken out on this home.
Original Mortgage
$200,600
Interest Rate
7.69%
Mortgage Type
New Conventional
Purchase Details
Closed on
May 4, 2000
Sold by
Ven Drees Bartlett Joint
Bought by
Drees Co
Create a Home Valuation Report for This Property
The Home Valuation Report is an in-depth analysis detailing your home's value as well as a comparison with similar homes in the area
Purchase History
We collect this data history from publicly available records. To have your information removed, we recommend requesting removal directly through your county’s website.
| Date | Buyer | Sale Price | Title Company |
|---|---|---|---|
| Moran Michael E | $255,000 | Tri-Star Title Agency Inc | |
| Walters Eric J | $222,900 | -- | |
| Drees Co | $56,000 | -- |
Source: Public Records
Mortgage History
We collect this data history from publicly available records. To have your information removed, we recommend requesting removal directly through your county’s website.
| Date | Status | Borrower | Loan Amount |
|---|---|---|---|
| Previous Owner | Moran Michael E | $216,750 | |
| Previous Owner | Walters Eric J | $200,600 |
Source: Public Records
Tax History
| Year | Tax Paid | Tax Assessment Tax Assessment Total Assessment is a certain percentage of the fair market value that is determined by local assessors to be the total taxable value of land and additions on the property. | Land | Improvement |
|---|---|---|---|---|
| 2025 | $6,682 | $131,150 | $20,300 | $110,850 |
| 2024 | $6,694 | $131,150 | $20,300 | $110,850 |
| 2023 | $6,724 | $131,150 | $20,300 | $110,850 |
| 2022 | $6,431 | $108,640 | $16,800 | $91,840 |
| 2021 | $6,457 | $108,640 | $16,800 | $91,840 |
| 2020 | $6,463 | $108,640 | $16,800 | $91,840 |
| 2019 | $4,880 | $95,410 | $16,800 | $78,610 |
| 2018 | $4,929 | $95,410 | $16,800 | $78,610 |
| 2017 | $4,445 | $95,410 | $16,800 | $78,610 |
| 2016 | $4,546 | $79,520 | $14,000 | $65,520 |
| 2015 | $4,316 | $79,520 | $14,000 | $65,520 |
| 2014 | $4,313 | $79,520 | $14,000 | $65,520 |
| 2013 | $4,237 | $77,280 | $15,400 | $61,880 |
Source: Public Records
Map
Nearby Homes
- 8616 Linderwood Ln
- 496 Mapleleaf Dr
- 553 Old Orchard Dr
- 8586 Sunmont Dr
- 1667 Clemson Cir
- 1682 Citadel Place
- 4009 Williams Dr
- 8680 Bethany Ln
- 212 Duchess Ln
- 8524 Sunmont Dr
- 1251 Eight Mile Rd
- 4150 Mt Carmel Tobasco Rd
- 4150 Mount Carmel Tobasco Rd
- 4182 Mount Carmel Tobasco Rd
- 1568 Tonopah Dr
- 0 Clough Pike Unit 1861584
- 1581 Tonopah Dr
- 1081 Oysterbay Dr
- 948 Nordyke Rd
- 1400 Sigma Cir
- 459 Gablefield Ct
- 463 Gablefield Ct
- 457 Gablefield Ct
- 465 Gablefield Ct
- 455 Gablefield Ct
- 4130 Brandonmore Dr
- 464 Gablefield Ct
- 456 Gablefield Ct
- 453 Gablefield Ct
- 462 Gablefield Ct
- 4132 Brandonmore Dr
- 454 Gablefield Ct
- 4134 Brandonmore Dr
- 451 Gablefield Ct
- 452 Gablefield Ct
- 461 Brandsteade Ct
- 4135 Brandonmore Dr
- 449 Gablefield Ct
- 4136 Brandonmore Dr
- 463 Brandsteade Ct
Your Personal Tour Guide
Ask me questions while you tour the home.