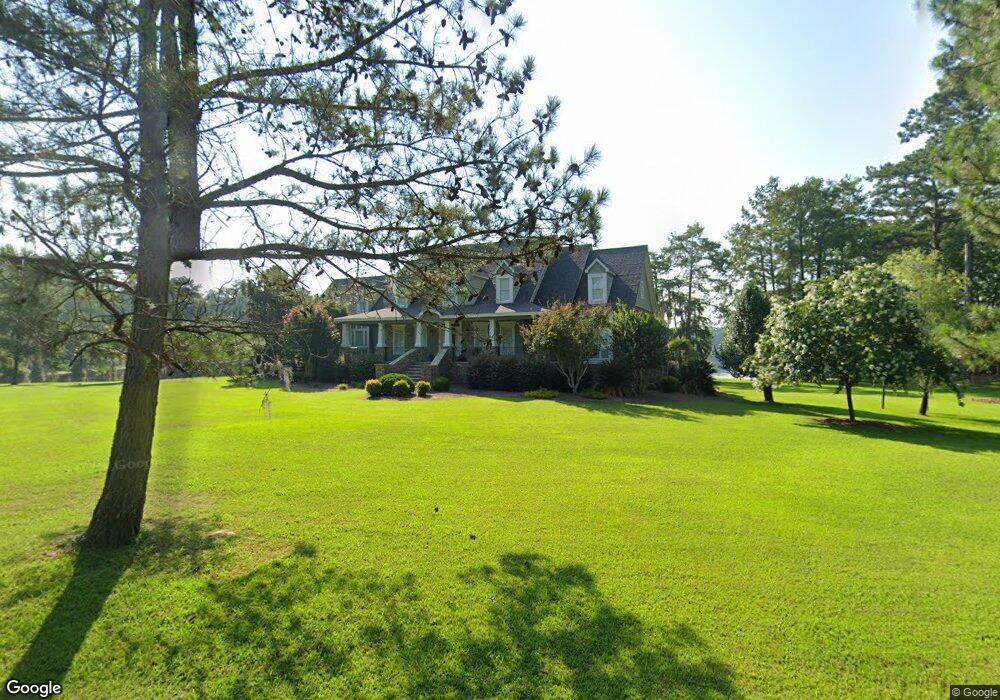
461 N Cedar Creek Rd Cordele, GA 31015
Estimated Value: $1,090,000 - $1,377,000
6
Beds
4
Baths
4,360
Sq Ft
$279/Sq Ft
Est. Value
About This Home
This home is located at 461 N Cedar Creek Rd, Cordele, GA 31015 and is currently estimated at $1,217,080, approximately $279 per square foot. 461 N Cedar Creek Rd is a home located in Crisp County with nearby schools including Crisp County Elementary School, Crisp County Primary School, and Crisp County Middle School.
Ownership History
Date
Name
Owned For
Owner Type
Purchase Details
Closed on
Oct 20, 2014
Sold by
Mccay Harold P
Bought by
Mccay Keela H
Current Estimated Value
Purchase Details
Closed on
Oct 19, 2006
Sold by
Mccay Harold P
Bought by
Mccay Harold P and Mccay Keele H
Purchase Details
Closed on
Jul 9, 1997
Sold by
Harris John Henry
Bought by
Mccay Harold P
Purchase Details
Closed on
Oct 16, 1995
Sold by
Harris Iris M
Bought by
Harris John Henry
Purchase Details
Closed on
Feb 7, 1989
Sold by
Harris John H
Bought by
Harris Iris M
Purchase Details
Closed on
Sep 13, 1979
Bought by
Harris John H
Create a Home Valuation Report for This Property
The Home Valuation Report is an in-depth analysis detailing your home's value as well as a comparison with similar homes in the area
Home Values in the Area
Average Home Value in this Area
Purchase History
| Date | Buyer | Sale Price | Title Company |
|---|---|---|---|
| Mccay Keela H | -- | -- | |
| Mccay Harold P | -- | -- | |
| Mccay Harold P | $90,900 | -- | |
| Harris John Henry | -- | -- | |
| Harris Iris M | $81,200 | -- | |
| Harris John H | -- | -- |
Source: Public Records
Tax History Compared to Growth
Tax History
| Year | Tax Paid | Tax Assessment Tax Assessment Total Assessment is a certain percentage of the fair market value that is determined by local assessors to be the total taxable value of land and additions on the property. | Land | Improvement |
|---|---|---|---|---|
| 2024 | $11,065 | $410,656 | $129,600 | $281,056 |
| 2023 | $9,571 | $342,807 | $129,600 | $213,207 |
| 2022 | $8,529 | $305,705 | $97,200 | $208,505 |
| 2021 | $8,024 | $270,604 | $97,200 | $173,404 |
| 2020 | $7,977 | $270,604 | $97,200 | $173,404 |
| 2019 | $7,926 | $270,604 | $97,200 | $173,404 |
| 2018 | $8,516 | $280,092 | $52,029 | $228,063 |
| 2017 | $8,613 | $280,092 | $52,029 | $228,063 |
| 2016 | $8,540 | $280,092 | $52,029 | $228,063 |
| 2015 | -- | $280,092 | $52,029 | $228,063 |
| 2014 | -- | $280,092 | $52,029 | $228,063 |
| 2013 | -- | $280,092 | $52,029 | $228,062 |
Source: Public Records
Map
Nearby Homes
- 475 N Cedar Creek Rd
- 153 Landing Rd
- 141 Landing Rd
- 984 Scenic Route
- 251 N Cedar Creek Rd
- 850 Scenic Route
- 103 Cedar Slough Ct
- 228 Cedar Point Cir
- Lot 1, 2 Scenic Route
- 580 Scenic Route
- Lot 3,4 Scenic Route
- 111 Cedar Creek Rd S
- 687 Flintside Dr
- 115 Ellis Ct
- 0 Coney Rd S
- 0 Lot #3 & Part Lot#4 Unit 59461
- 600 Scenic Route
- 631 Flintside Dr
- 515 Scenic Route
- 466 Scenic Route
- 466 N Cedar Creek Rd
- 452 N Cedar Creek Rd
- 473 N Cedar Creek Rd
- 353 N Cedar Creek Rd
- 477 N Cedar Creek Rd
- 349 N Cedar Creek Rd
- 479 N Cedar Creek Rd
- 481 N Cedar Creek Rd
- 345 N Cedar Creek Rd
- 483 N Cedar Creek Rd
- 487 N Cedar Creek Rd
- 337 N Cedar Creek Rd
- 126 Landing Ct
- 499 N Cedar Creek Rd
- 127 Landing Ct
- 504 N Cedar Creek Rd
- 333 N Cedar Creek Rd
- 118 Landing Ct
- 121 Landing Ct
- 505 N Cedar Creek Rd