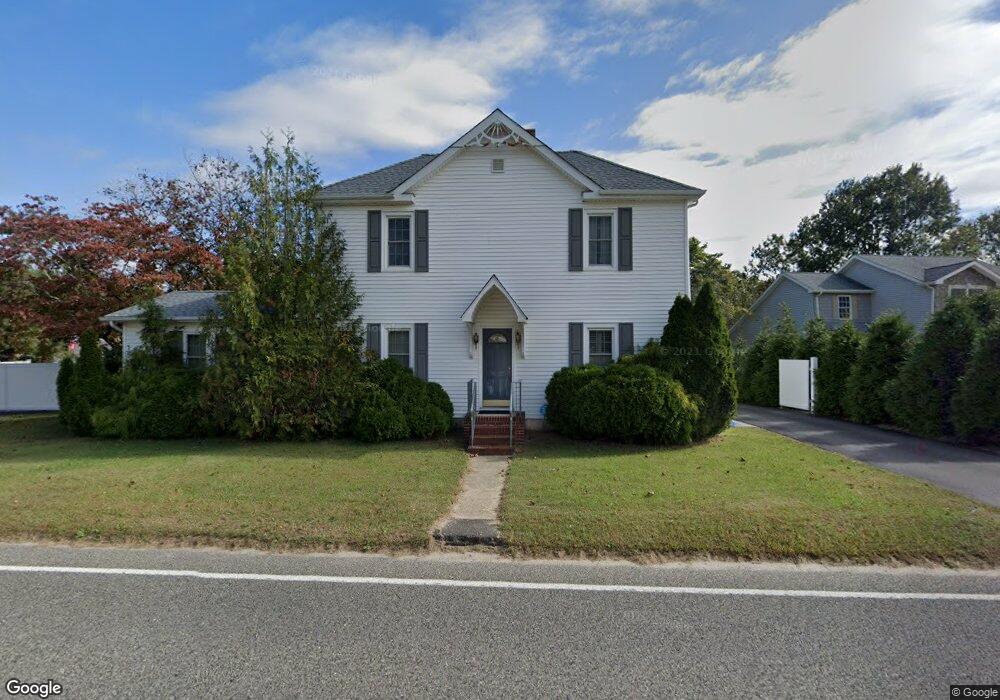
461 N Chew Rd Hammonton, NJ 08037
Estimated Value: $331,000 - $445,000
Studio
--
Bath
1,892
Sq Ft
$206/Sq Ft
Est. Value
About This Home
This home is located at 461 N Chew Rd, Hammonton, NJ 08037 and is currently estimated at $389,547, approximately $205 per square foot. 461 N Chew Rd is a home located in Atlantic County with nearby schools including Hammonton Early Childhood Education Center, Warren E. Sooy Jr. Elementary School, and Hammonton Middle School.
Ownership History
Date
Name
Owned For
Owner Type
Purchase Details
Closed on
Mar 17, 1994
Sold by
Olivei Matthew J
Bought by
Corrado Michael and Corrado Cynthia
Current Estimated Value
Purchase Details
Closed on
Mar 31, 1989
Sold by
Olive Matthew J and Olive Bombara,Marie
Bought by
Olive Matthew J and Olive Bombara,Marie
Create a Home Valuation Report for This Property
The Home Valuation Report is an in-depth analysis detailing your home's value as well as a comparison with similar homes in the area
Home Values in the Area
Average Home Value in this Area
Purchase History
| Date | Buyer | Sale Price | Title Company |
|---|---|---|---|
| Corrado Michael | $60,000 | -- | |
| Olive Matthew J | -- | -- |
Source: Public Records
Tax History
| Year | Tax Paid | Tax Assessment Tax Assessment Total Assessment is a certain percentage of the fair market value that is determined by local assessors to be the total taxable value of land and additions on the property. | Land | Improvement |
|---|---|---|---|---|
| 2025 | $5,947 | $216,100 | $63,000 | $153,100 |
| 2024 | $5,947 | $216,100 | $63,000 | $153,100 |
Source: Public Records
Map
Nearby Homes