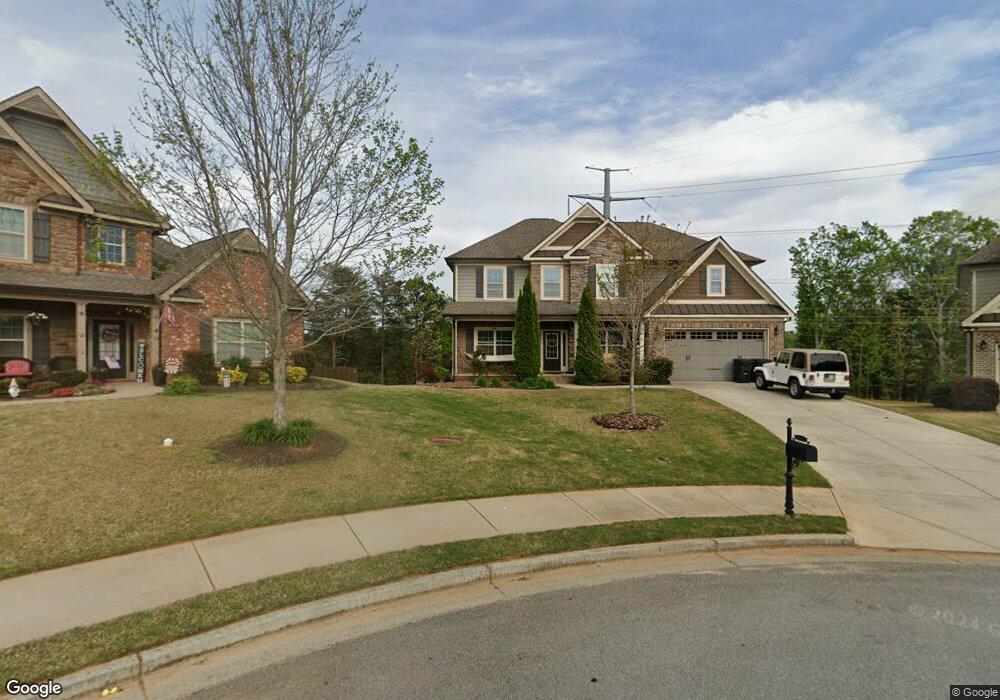
461 Sweet Apple Ln Unit 15 Buford, GA 30518
Estimated Value: $702,192 - $877,000
5
Beds
4
Baths
3,817
Sq Ft
$205/Sq Ft
Est. Value
About This Home
This home is located at 461 Sweet Apple Ln Unit 15, Buford, GA 30518 and is currently estimated at $782,548, approximately $205 per square foot. 461 Sweet Apple Ln Unit 15 is a home located in Hall County with nearby schools including Buford Elementary School, Buford Academy, and Buford Senior Academy.
Ownership History
Date
Name
Owned For
Owner Type
Purchase Details
Closed on
Apr 27, 2023
Sold by
Young Jason
Bought by
Orton Zachary Jon and Orton Rachel
Current Estimated Value
Home Financials for this Owner
Home Financials are based on the most recent Mortgage that was taken out on this home.
Original Mortgage
$527,200
Outstanding Balance
$512,353
Interest Rate
6.32%
Mortgage Type
New Conventional
Estimated Equity
$270,195
Purchase Details
Closed on
Mar 9, 2015
Sold by
Sweet Apple Llc
Bought by
Young Jason and Young Jennifer L
Home Financials for this Owner
Home Financials are based on the most recent Mortgage that was taken out on this home.
Original Mortgage
$240,000
Interest Rate
3.69%
Mortgage Type
New Conventional
Purchase Details
Closed on
Dec 27, 2013
Sold by
The Brand Banking Co
Bought by
Thunder Road Partners Llc
Purchase Details
Closed on
Dec 7, 2010
Sold by
Sheriff Of Hall County
Bought by
Brand Banking Co
Create a Home Valuation Report for This Property
The Home Valuation Report is an in-depth analysis detailing your home's value as well as a comparison with similar homes in the area
Home Values in the Area
Average Home Value in this Area
Purchase History
| Date | Buyer | Sale Price | Title Company |
|---|---|---|---|
| Orton Zachary Jon | $659,000 | -- | |
| Young Jason | $300,000 | -- | |
| Thunder Road Partners Llc | -- | -- | |
| Sweet Apple Llc | $134,500 | -- | |
| Brand Banking Co | $25,100 | -- | |
| The Brand Banking Company | -- | -- |
Source: Public Records
Mortgage History
| Date | Status | Borrower | Loan Amount |
|---|---|---|---|
| Open | Orton Zachary Jon | $527,200 | |
| Previous Owner | Young Jason | $240,000 |
Source: Public Records
Tax History Compared to Growth
Tax History
| Year | Tax Paid | Tax Assessment Tax Assessment Total Assessment is a certain percentage of the fair market value that is determined by local assessors to be the total taxable value of land and additions on the property. | Land | Improvement |
|---|---|---|---|---|
| 2024 | $4,775 | $227,880 | $16,000 | $211,880 |
| 2023 | $1,829 | $216,320 | $16,000 | $200,320 |
| 2022 | $1,804 | $197,000 | $16,000 | $181,000 |
| 2021 | $1,812 | $187,760 | $16,000 | $171,760 |
| 2020 | $1,771 | $179,440 | $16,000 | $163,440 |
| 2019 | $1,758 | $173,880 | $16,000 | $157,880 |
| 2018 | $1,545 | $148,960 | $12,000 | $136,960 |
| 2017 | $1,495 | $138,680 | $12,000 | $126,680 |
| 2016 | $1,176 | $126,200 | $12,000 | $114,200 |
| 2015 | -- | $131,040 | $6,000 | $125,040 |
| 2014 | -- | $6,000 | $6,000 | $0 |
Source: Public Records
Map
Nearby Homes
- 170 Slate Dr
- 879 Gainesville Hwy
- 454 Thunder Rd
- 446 Thunder Rd
- 452 Thunder Rd
- 450 Thunder Rd
- 403 Thunder Rd
- 405 Thunder Rd
- 119 Holiday Rd Unit 202
- 119 Holiday Rd Unit 201
- 119 Holiday Rd Unit 1202
- 5639 Holiday Rd
- 5758 Hickory Wood Ln
- 5758 Hickory Wood Ln Unit 336
- 0 McEver Rd Unit 10506093
- 2999 S Waterworks Rd
- 4653 Whispering Pines
- 4653 Whispering Pines Unit 449
- 3180 Lee Dr
- 461 Sweet Apple Ln
- 457 Sweet Apple Ln
- 453 Sweet Apple Ln
- 458 Sweet Apple Ln
- 449 Sweet Apple Ln
- 452 Sweet Apple Ln
- 155 Slate Dr
- 151 Slate Dr Unit 15
- 151 Slate Dr
- 409 Apple Tree Way
- 445 Sweet Apple Ln
- 417 Apple Tree Way
- 159 Slate Dr
- 437 Apple Tree Way Unit 22
- 437 Apple Tree Way
- 425 Apple Tree Way
- 884 Gainesville Hwy
- 0 Apple Tree Way Unit 7246285
- 0 Apple Tree Way Unit 7326255
- 0 Apple Tree Way Unit 7326250