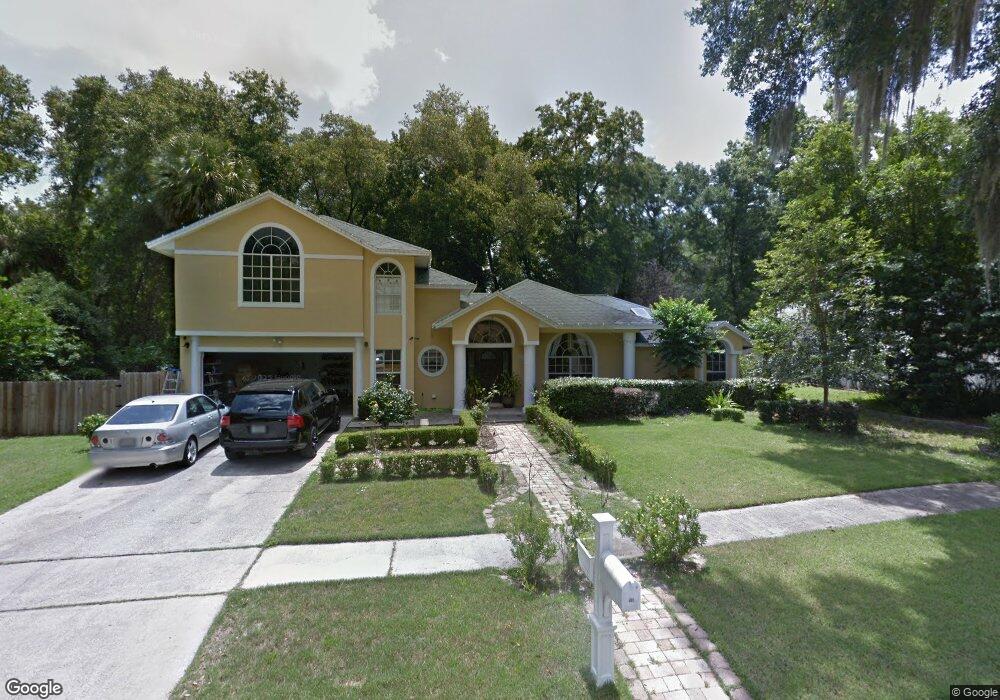
461 Via Florence Dr Apopka, FL 32712
Estimated Value: $312,605 - $391,000
3
Beds
3
Baths
2,607
Sq Ft
$133/Sq Ft
Est. Value
About This Home
This home is located at 461 Via Florence Dr, Apopka, FL 32712 and is currently estimated at $347,651, approximately $133 per square foot. 461 Via Florence Dr is a home located in Orange County with nearby schools including Clay Springs Elementary School, Apopka Middle School, and Apopka High School.
Ownership History
Date
Name
Owned For
Owner Type
Purchase Details
Closed on
Jul 8, 2021
Sold by
Schroll Gabriel
Bought by
Estrada Jennifer L
Current Estimated Value
Home Financials for this Owner
Home Financials are based on the most recent Mortgage that was taken out on this home.
Original Mortgage
$140,000
Interest Rate
2.8%
Mortgage Type
New Conventional
Purchase Details
Closed on
Jan 24, 2021
Sold by
Estrada Hazel and Kenady Hazel
Bought by
Estrada Jennifer
Purchase Details
Closed on
Jun 27, 2011
Sold by
Federal National Mortgage Association
Bought by
Estrada Hazel and Schroll Gabriel
Home Financials for this Owner
Home Financials are based on the most recent Mortgage that was taken out on this home.
Original Mortgage
$117,932
Interest Rate
4.06%
Mortgage Type
FHA
Purchase Details
Closed on
Aug 13, 2010
Sold by
Long Dennis A and Long Anna M
Bought by
Federal National Mortgage Association
Create a Home Valuation Report for This Property
The Home Valuation Report is an in-depth analysis detailing your home's value as well as a comparison with similar homes in the area
Home Values in the Area
Average Home Value in this Area
Purchase History
| Date | Buyer | Sale Price | Title Company |
|---|---|---|---|
| Estrada Jennifer L | $175,000 | Attorney | |
| Estrada Jennifer | -- | Accommodation | |
| Estrada Hazel | $122,900 | Dba Volusia Title Services | |
| Federal National Mortgage Association | $176,200 | Watson Title Ins Inc |
Source: Public Records
Mortgage History
| Date | Status | Borrower | Loan Amount |
|---|---|---|---|
| Previous Owner | Estrada Jennifer L | $140,000 | |
| Previous Owner | Estrada Hazel | $117,932 |
Source: Public Records
Tax History Compared to Growth
Tax History
| Year | Tax Paid | Tax Assessment Tax Assessment Total Assessment is a certain percentage of the fair market value that is determined by local assessors to be the total taxable value of land and additions on the property. | Land | Improvement |
|---|---|---|---|---|
| 2025 | $5,036 | $293,250 | $80,000 | $213,250 |
| 2024 | $3,988 | $283,100 | $80,000 | $203,100 |
| 2023 | $3,988 | $267,354 | $0 | $0 |
| 2022 | $3,836 | $259,567 | $80,000 | $179,567 |
| 2021 | $3,854 | $217,633 | $60,000 | $157,633 |
| 2020 | $3,588 | $208,851 | $50,000 | $158,851 |
| 2019 | $3,659 | $210,068 | $50,000 | $160,068 |
| 2018 | $3,286 | $177,139 | $33,000 | $144,139 |
| 2017 | $3,077 | $163,770 | $30,000 | $133,770 |
| 2016 | $3,037 | $159,855 | $30,000 | $129,855 |
| 2015 | $2,905 | $151,788 | $30,000 | $121,788 |
| 2014 | $2,679 | $131,115 | $30,000 | $101,115 |
Source: Public Records
Map
Nearby Homes
- 445 Songbird Way
- 405 April Ln
- 524 Ellie Ct
- 530 Ellie Ct
- 424 Dominish Estates Dr
- 464 Dominish Estates Dr
- 453 Dominish Estates Dr
- 1214 Votaw Rd
- 390 Lake McCoy Dr
- 111 N Cervidae Dr
- 575 Lake McCoy Dr
- 1022 Love Ln Unit 35
- 333 Bay St
- 1011 Love Ln Unit 31
- 309 Bay St
- 1005 Love Ln Unit 25
- 320 Avalone Dr
- CALI Plan at Sagewood
- Hayden Plan at Sagewood
- Elle Plan at Sagewood
- 449 Via Florence Dr
- 831 Votaw Rd
- 460 Via Florence Dr
- 504 Via Florence Dr
- 448 Via Florence Dr
- 437 Via Florence Dr
- 516 Via Florence Dr
- 436 Via Florence Dr
- 527 Via Florence Dr
- 435 April Ln
- 429 April Ln
- 425 Via Florence Dr
- 441 April Ln
- 833 Votaw Rd
- 528 Via Florence Dr
- 423 April Ln
- 424 Via Florence Dr
- 455 April Ln
- 539 Via Florence Dr
- 413 Via Florence Dr