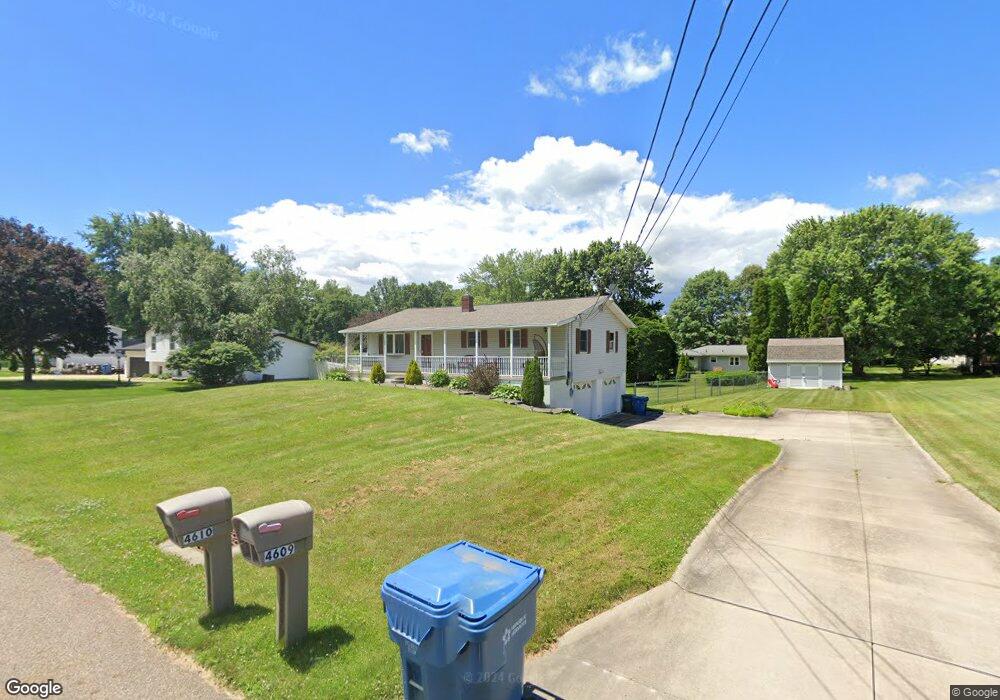
4610 Mars Rd Uniontown, OH 44685
Estimated Value: $218,000 - $269,000
3
Beds
2
Baths
1,288
Sq Ft
$188/Sq Ft
Est. Value
About This Home
This home is located at 4610 Mars Rd, Uniontown, OH 44685 and is currently estimated at $241,619, approximately $187 per square foot. 4610 Mars Rd is a home located in Summit County with nearby schools including Greenwood Elementary School, Green Intermediate Elementary School, and Green Primary School.
Ownership History
Date
Name
Owned For
Owner Type
Purchase Details
Closed on
Nov 4, 2021
Sold by
Morse Daniel P and Morse Rebecca R
Bought by
Marcinko Jonathan
Current Estimated Value
Home Financials for this Owner
Home Financials are based on the most recent Mortgage that was taken out on this home.
Original Mortgage
$189,504
Outstanding Balance
$173,381
Interest Rate
2.88%
Mortgage Type
FHA
Estimated Equity
$68,238
Purchase Details
Closed on
May 27, 2003
Sold by
White Kerry L and White Laurie A
Bought by
Morse Daniel P and Morse Rebecca R
Create a Home Valuation Report for This Property
The Home Valuation Report is an in-depth analysis detailing your home's value as well as a comparison with similar homes in the area
Home Values in the Area
Average Home Value in this Area
Purchase History
| Date | Buyer | Sale Price | Title Company |
|---|---|---|---|
| Marcinko Jonathan | $193,000 | None Available | |
| Morse Daniel P | $159,000 | Bond & Associates Title Agen |
Source: Public Records
Mortgage History
| Date | Status | Borrower | Loan Amount |
|---|---|---|---|
| Open | Marcinko Jonathan | $189,504 |
Source: Public Records
Tax History Compared to Growth
Tax History
| Year | Tax Paid | Tax Assessment Tax Assessment Total Assessment is a certain percentage of the fair market value that is determined by local assessors to be the total taxable value of land and additions on the property. | Land | Improvement |
|---|---|---|---|---|
| 2025 | $3,212 | $64,821 | $13,024 | $51,797 |
| 2024 | $3,212 | $64,821 | $13,024 | $51,797 |
| 2023 | $3,212 | $64,821 | $13,024 | $51,797 |
| 2022 | $2,772 | $50,015 | $10,017 | $39,998 |
| 2021 | $2,018 | $50,015 | $10,017 | $39,998 |
| 2020 | $1,979 | $50,020 | $10,020 | $40,000 |
| 2019 | $2,111 | $50,020 | $10,020 | $40,000 |
| 2018 | $2,158 | $50,020 | $10,020 | $40,000 |
| 2017 | $1,866 | $50,020 | $10,020 | $40,000 |
| 2016 | $1,857 | $42,250 | $10,020 | $32,230 |
| 2015 | $1,866 | $42,250 | $10,020 | $32,230 |
| 2014 | $1,854 | $42,250 | $10,020 | $32,230 |
| 2013 | $1,643 | $38,180 | $10,020 | $28,160 |
Source: Public Records
Map
Nearby Homes
- 683 Chilham Cir
- 4529-4533 Camelot Cir
- 4441 Merlin Dr
- 4710 Pinecrest Dr
- 4259 Arlington Rd
- 4881 S Main St
- 4 Shrakes Hotel Dr
- 3 Shrakes Hotel Dr
- 6 Shrakes Hotel Dr
- 5 Shrakes Hotel Dr
- 7 Shrakes Hotel Dr
- 4674 S Main St
- S/L 14,15 Shakes Hotel Dr
- lot 8 Whyem Dr
- 4298 S Main St Unit 4302
- 3943 Crest View Dr
- 1008 Dalby Cir
- 0 Kenway Blvd Unit 5162986
- 3680 Kenway Blvd
- 4394 Ridge View Dr