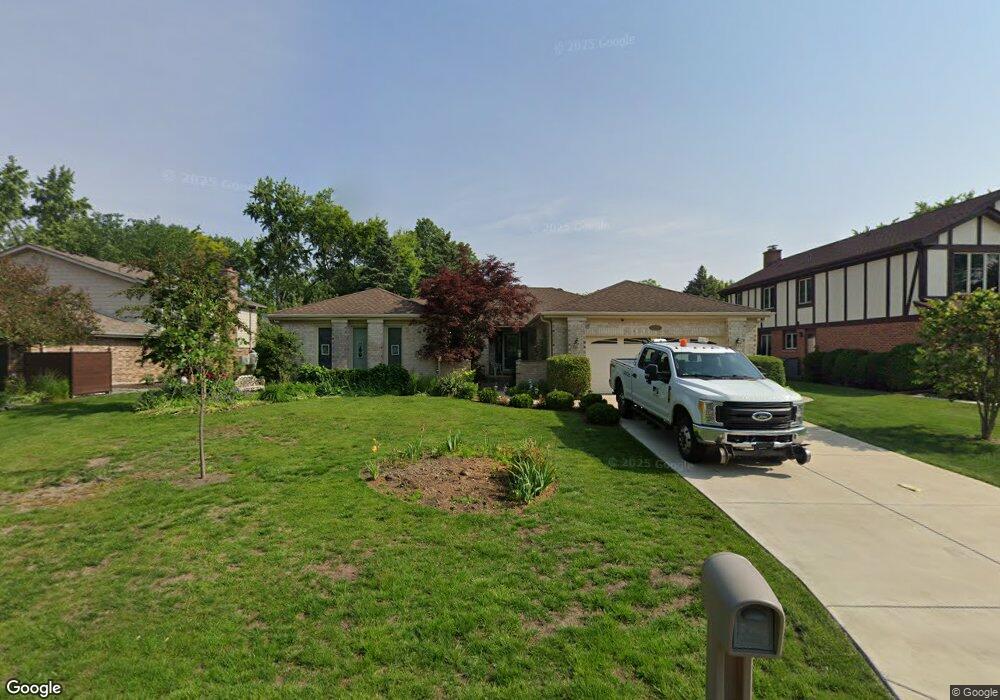
4610 Mckone Ct Rolling Meadows, IL 60008
Creekside NeighborhoodEstimated Value: $590,468 - $686,000
5
Beds
3
Baths
2,744
Sq Ft
$227/Sq Ft
Est. Value
About This Home
This home is located at 4610 Mckone Ct, Rolling Meadows, IL 60008 and is currently estimated at $623,867, approximately $227 per square foot. 4610 Mckone Ct is a home located in Cook County with nearby schools including Willow Bend Elementary School, Galatia Junior High School, and William Fremd High School.
Ownership History
Date
Name
Owned For
Owner Type
Purchase Details
Closed on
Sep 19, 2006
Sold by
Revoc Hennessy Jr H Richard
Bought by
Revocabl Hennessy Jr H Richard and H Richard Hennessy Jr Revocable Living T
Current Estimated Value
Purchase Details
Closed on
Oct 22, 2003
Sold by
Primacy Closing Corp
Bought by
Hennessy H Richard and Hennessy Brenda Crandall
Purchase Details
Closed on
Oct 18, 2003
Sold by
Keenan Mariann B and Keenan Robert L
Bought by
Primacy Closing Corp
Purchase Details
Closed on
Oct 29, 1997
Sold by
Macarthur Mary E
Bought by
Keenan Robert L and Keenan Mariann B
Home Financials for this Owner
Home Financials are based on the most recent Mortgage that was taken out on this home.
Original Mortgage
$234,700
Interest Rate
7.43%
Create a Home Valuation Report for This Property
The Home Valuation Report is an in-depth analysis detailing your home's value as well as a comparison with similar homes in the area
Home Values in the Area
Average Home Value in this Area
Purchase History
| Date | Buyer | Sale Price | Title Company |
|---|---|---|---|
| Revocabl Hennessy Jr H Richard | -- | None Available | |
| Hennessy H Richard | $454,000 | -- | |
| Primacy Closing Corp | $454,000 | First American | |
| Keenan Robert L | $208,666 | -- |
Source: Public Records
Mortgage History
| Date | Status | Borrower | Loan Amount |
|---|---|---|---|
| Previous Owner | Keenan Robert L | $234,700 |
Source: Public Records
Tax History Compared to Growth
Tax History
| Year | Tax Paid | Tax Assessment Tax Assessment Total Assessment is a certain percentage of the fair market value that is determined by local assessors to be the total taxable value of land and additions on the property. | Land | Improvement |
|---|---|---|---|---|
| 2024 | $9,845 | $37,200 | $6,248 | $30,952 |
| 2023 | $10,895 | $42,002 | $6,248 | $35,754 |
| 2022 | $10,895 | $42,002 | $6,248 | $35,754 |
| 2021 | $10,089 | $35,450 | $3,976 | $31,474 |
| 2020 | $10,078 | $35,450 | $3,976 | $31,474 |
| 2019 | $10,546 | $40,954 | $3,976 | $36,978 |
| 2018 | $10,750 | $38,349 | $3,692 | $34,657 |
| 2017 | $11,883 | $42,382 | $3,692 | $38,690 |
| 2016 | $11,599 | $42,382 | $3,692 | $38,690 |
| 2015 | $10,815 | $37,708 | $3,408 | $34,300 |
| 2014 | $10,619 | $37,708 | $3,408 | $34,300 |
| 2013 | $10,312 | $37,708 | $3,408 | $34,300 |
Source: Public Records
Map
Nearby Homes
- 200 Edgewood Ln
- 208 Brookdale Ln
- 160 E Forest Ln
- 2600 Brookwood Way Dr Unit 316
- 2600 Brookwood Way Dr Unit 305
- 2600 Brookwood Unit 314
- 2600 Brookwood Way Dr Unit 212
- 123 Honeysuckle Ct
- 4941 Emerson Ave
- 1292 Quadrant Ln
- 1272 Quadrant Ln
- 1294 Catalina Ct
- 3805 Fairfax Ave
- 2 Croydon on Duxbury
- Grant Plan at Northgate at Veridian
- 2041 Vermont St
- 4 Eton on Oxford
- 1620 Waxwing Ct
- 1609 Waxwing Ct
- 4301 Euclid Ave
- 4620 Mckone Ct
- 4600 Mckone Ct
- 3201 California Ave
- 4630 Mckone Ct
- 3205 California Ave
- 4615 Mckone Ct
- 4625 Mckone Ct
- 3301 California Ave
- 3139 California Ct
- 4635 Mckone Ct
- 4630 Teonia Woods Dr
- 4632 Mckone Ct
- 3129 California Ct
- 4531 Dawngate Ln
- 4551 Dawngate Ln
- 4621 Dawngate Ln
- 4633 Teonia Woods Dr
- 4571 Dawngate Ln
- 4530 Tall Oaks Ln
- 4540 Tall Oaks Ln