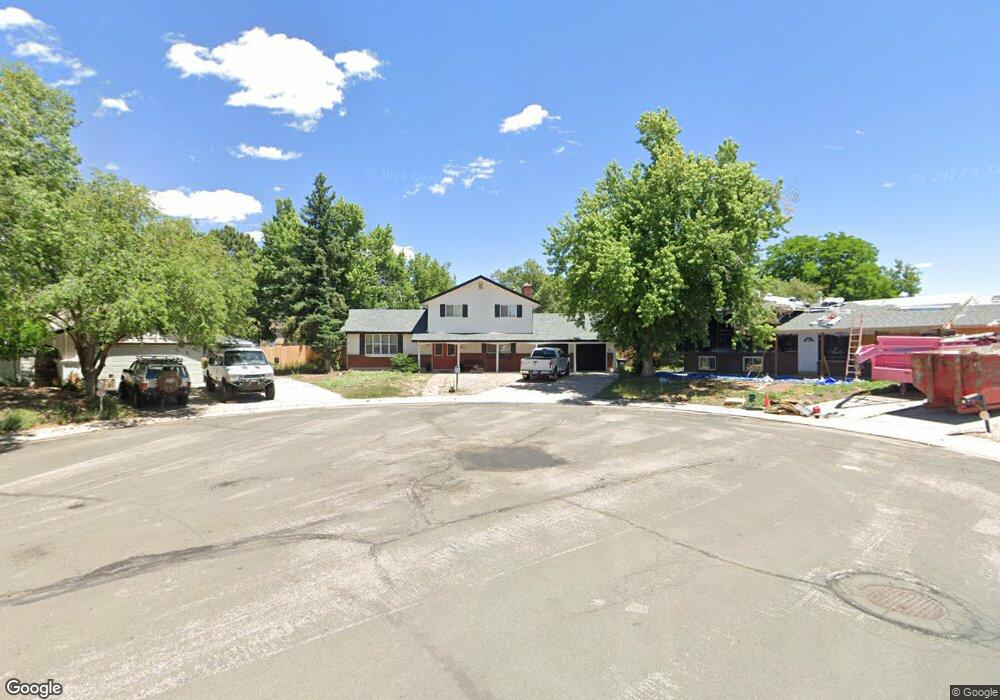
4610 Moffat Ln Colorado Springs, CO 80915
Rustic Hills NeighborhoodEstimated Value: $413,000 - $492,000
4
Beds
3
Baths
1,987
Sq Ft
$224/Sq Ft
Est. Value
About This Home
This home is located at 4610 Moffat Ln, Colorado Springs, CO 80915 and is currently estimated at $445,634, approximately $224 per square foot. 4610 Moffat Ln is a home located in El Paso County with nearby schools including Wilson Elementary School, Sabin Middle School, and Mitchell High School.
Ownership History
Date
Name
Owned For
Owner Type
Purchase Details
Closed on
Aug 24, 2012
Sold by
Peak Rehab #1 Llc
Bought by
Miller Raymond U and Miller Carrie L
Current Estimated Value
Home Financials for this Owner
Home Financials are based on the most recent Mortgage that was taken out on this home.
Original Mortgage
$187,147
Outstanding Balance
$130,133
Interest Rate
3.75%
Mortgage Type
FHA
Estimated Equity
$315,501
Purchase Details
Closed on
May 7, 2012
Sold by
Sullivan Kathleen Anne
Bought by
Peak Rehab #11 Llc
Home Financials for this Owner
Home Financials are based on the most recent Mortgage that was taken out on this home.
Original Mortgage
$97,597
Interest Rate
4.11%
Mortgage Type
Unknown
Purchase Details
Closed on
Apr 26, 2011
Sold by
Devries John A
Bought by
Devries Merrie Ann and Sullivan Kathleen Anne
Purchase Details
Closed on
Jul 3, 1973
Bought by
Miller Raymond U
Create a Home Valuation Report for This Property
The Home Valuation Report is an in-depth analysis detailing your home's value as well as a comparison with similar homes in the area
Home Values in the Area
Average Home Value in this Area
Purchase History
| Date | Buyer | Sale Price | Title Company |
|---|---|---|---|
| Miller Raymond U | $190,600 | None Available | |
| Peak Rehab #11 Llc | $92,000 | Heritage Title | |
| Devries Merrie Ann | -- | None Available | |
| Miller Raymond U | -- | -- |
Source: Public Records
Mortgage History
| Date | Status | Borrower | Loan Amount |
|---|---|---|---|
| Open | Miller Raymond U | $187,147 | |
| Previous Owner | Peak Rehab #11 Llc | $97,597 |
Source: Public Records
Tax History Compared to Growth
Tax History
| Year | Tax Paid | Tax Assessment Tax Assessment Total Assessment is a certain percentage of the fair market value that is determined by local assessors to be the total taxable value of land and additions on the property. | Land | Improvement |
|---|---|---|---|---|
| 2025 | $1,532 | $30,470 | -- | -- |
| 2024 | $1,418 | $32,000 | $4,150 | $27,850 |
| 2023 | $1,418 | $32,000 | $4,150 | $27,850 |
| 2022 | $1,257 | $22,470 | $3,340 | $19,130 |
| 2021 | $1,364 | $23,120 | $3,430 | $19,690 |
| 2020 | $1,351 | $19,900 | $3,000 | $16,900 |
| 2019 | $1,343 | $19,900 | $3,000 | $16,900 |
| 2018 | $1,178 | $16,050 | $2,380 | $13,670 |
| 2017 | $1,115 | $16,050 | $2,380 | $13,670 |
| 2016 | $885 | $15,270 | $2,310 | $12,960 |
| 2015 | $882 | $15,270 | $2,310 | $12,960 |
| 2014 | $867 | $14,410 | $2,310 | $12,100 |
Source: Public Records
Map
Nearby Homes
- 1103 Turley Cir
- 4706 Woodbury Dr
- 1125 Moffat Cir
- 1216 Osgood Rd
- 1202 Wooten Rd
- 1239 Martin Dr
- 1222 de Reamer Cir
- 5102 Galley Rd Unit 520AE
- 5102 Galley Rd Unit 120A
- 1414 Martin Dr
- 1770 Sawyer Way
- 1501 E Owen Cir
- 713 Lansing Dr
- 1508 E Owen Cir
- 1426 de Reamer Cir
- 5007 Palmer Park Blvd
- 1505 Mckay Way
- 5014 Palmer Park Blvd
- 1044 Doyle Place
- 1518 Sanderson Ave
- 1022 Turley Dr
- 4606 Moffat Ln
- 4614 Moffat Ln
- 4613 Woodbury Dr
- 4609 Woodbury Dr
- 1028 Turley Dr
- 4617 Woodbury Dr
- 1014 Turley Dr
- 4605 Woodbury Dr
- 4602 Moffat Ln
- 1032 Turley Dr
- 4611 Moffat Ln
- 1021 Moffat Cir
- 1010 Turley Dr
- 4607 Moffat Ln
- 1023 Turley Dr
- 1019 Turley Dr
- 1027 Turley Dr
- 4603 Moffat Ln
- 1015 Turley Dr