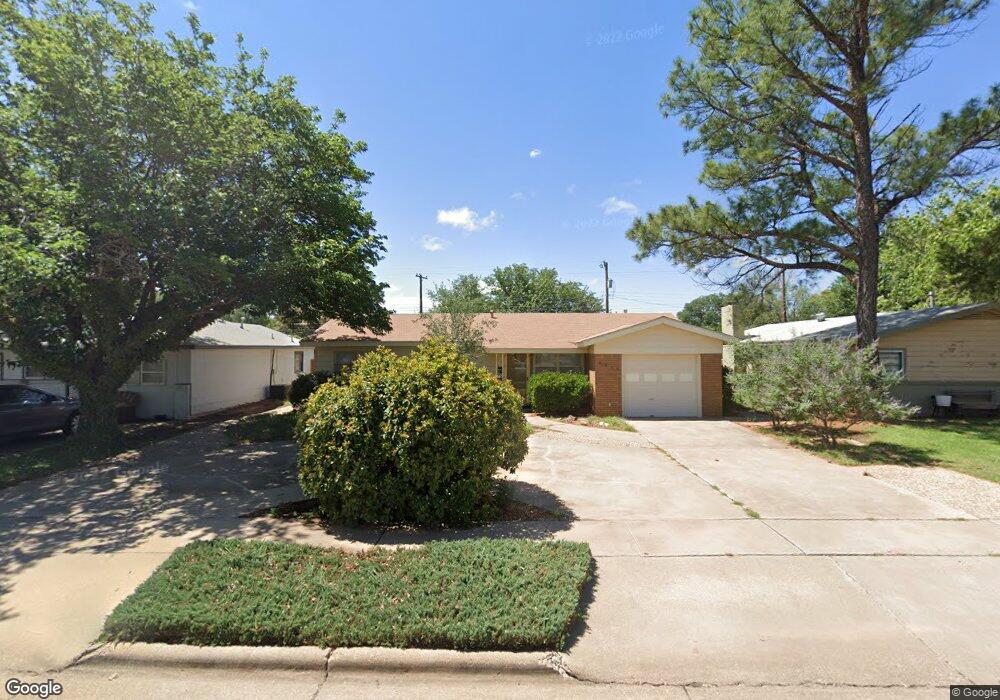
4611 45th St Lubbock, TX 79414
Stubbs-Stewart NeighborhoodEstimated Value: $131,000 - $149,000
3
Beds
2
Baths
1,179
Sq Ft
$117/Sq Ft
Est. Value
About This Home
This home is located at 4611 45th St, Lubbock, TX 79414 and is currently estimated at $138,046, approximately $117 per square foot. 4611 45th St is a home located in Lubbock County with nearby schools including Stewart Elementary School, Commander William C. McCool Academy, and Irons Middle School.
Ownership History
Date
Name
Owned For
Owner Type
Purchase Details
Closed on
Mar 7, 2011
Sold by
Mitchell Dorothy and Mitchell James Dannis
Bought by
Lemon James Clay and Lemon Linda Sue
Current Estimated Value
Home Financials for this Owner
Home Financials are based on the most recent Mortgage that was taken out on this home.
Original Mortgage
$58,452
Outstanding Balance
$40,049
Interest Rate
4.73%
Mortgage Type
New Conventional
Estimated Equity
$97,997
Create a Home Valuation Report for This Property
The Home Valuation Report is an in-depth analysis detailing your home's value as well as a comparison with similar homes in the area
Home Values in the Area
Average Home Value in this Area
Purchase History
| Date | Buyer | Sale Price | Title Company |
|---|---|---|---|
| Lemon James Clay | -- | Lubbock Abstract & Title Co |
Source: Public Records
Mortgage History
| Date | Status | Borrower | Loan Amount |
|---|---|---|---|
| Open | Lemon James Clay | $58,452 |
Source: Public Records
Tax History Compared to Growth
Tax History
| Year | Tax Paid | Tax Assessment Tax Assessment Total Assessment is a certain percentage of the fair market value that is determined by local assessors to be the total taxable value of land and additions on the property. | Land | Improvement |
|---|---|---|---|---|
| 2025 | $2,316 | $139,994 | $23,500 | $116,494 |
| 2024 | $2,316 | $127,534 | $23,500 | $104,034 |
| 2023 | $2,243 | $120,644 | $10,380 | $110,264 |
| 2022 | $2,228 | $110,054 | $10,380 | $99,674 |
| 2021 | $2,236 | $104,391 | $10,380 | $94,011 |
| 2020 | $1,888 | $86,834 | $10,380 | $76,454 |
| 2019 | $2,000 | $89,100 | $10,380 | $78,720 |
| 2018 | $2,003 | $89,100 | $10,380 | $78,720 |
| 2017 | $1,738 | $77,207 | $10,380 | $66,827 |
| 2016 | $1,636 | $72,676 | $10,380 | $62,296 |
| 2015 | $1,419 | $71,202 | $10,380 | $60,822 |
| 2014 | $1,419 | $63,821 | $3,900 | $59,921 |
Source: Public Records
Map
Nearby Homes