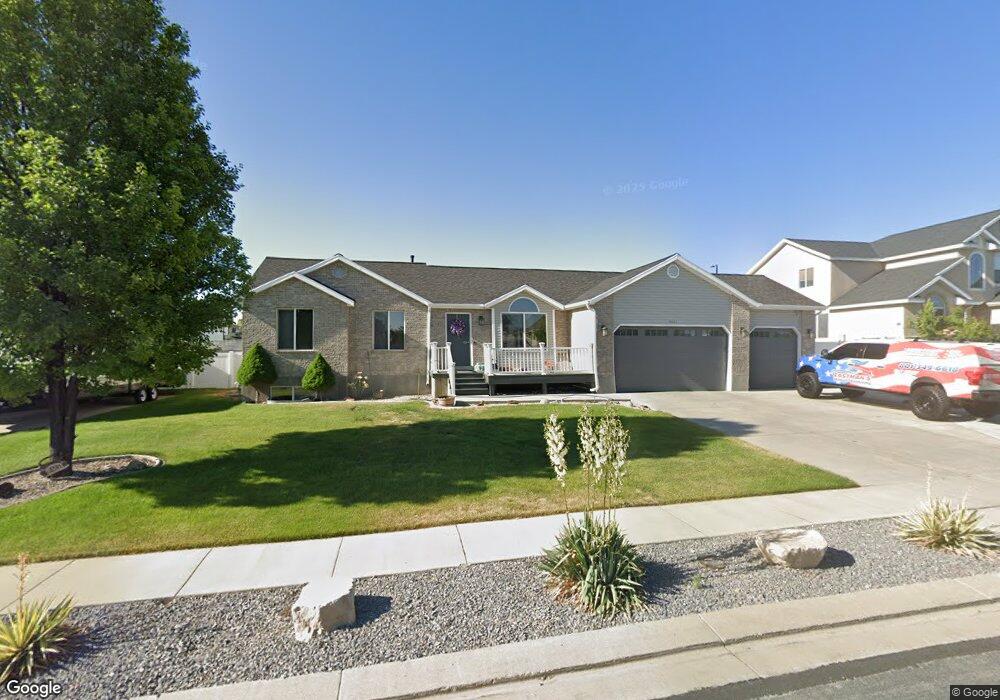
4611 Balsam Pine Dr West Jordan, UT 84088
Jordan Oaks NeighborhoodEstimated Value: $590,000 - $662,000
3
Beds
3
Baths
1,371
Sq Ft
$456/Sq Ft
Est. Value
About This Home
This home is located at 4611 Balsam Pine Dr, West Jordan, UT 84088 and is currently estimated at $625,214, approximately $456 per square foot. 4611 Balsam Pine Dr is a home located in Salt Lake County with nearby schools including Jordan Hills Elementary School, West Hills Middle School, and Copper Hills High School.
Ownership History
Date
Name
Owned For
Owner Type
Purchase Details
Closed on
Feb 28, 2020
Sold by
Kandi Llc
Bought by
Eastman Aaron Reese and Schacht Eastman Jenilyn
Current Estimated Value
Home Financials for this Owner
Home Financials are based on the most recent Mortgage that was taken out on this home.
Original Mortgage
$361,250
Outstanding Balance
$339,876
Interest Rate
7.62%
Mortgage Type
New Conventional
Estimated Equity
$285,338
Purchase Details
Closed on
Jul 9, 2019
Sold by
4611 Balsam Llc
Bought by
Kandi Llc
Purchase Details
Closed on
May 25, 1999
Sold by
Rochelle Park Lc
Bought by
Downward Robert J and Downward Tonia J
Home Financials for this Owner
Home Financials are based on the most recent Mortgage that was taken out on this home.
Original Mortgage
$144,290
Interest Rate
6.84%
Mortgage Type
FHA
Create a Home Valuation Report for This Property
The Home Valuation Report is an in-depth analysis detailing your home's value as well as a comparison with similar homes in the area
Home Values in the Area
Average Home Value in this Area
Purchase History
| Date | Buyer | Sale Price | Title Company |
|---|---|---|---|
| Eastman Aaron Reese | -- | Sutherland Title | |
| Kandi Llc | -- | Accommodation | |
| 4611 Balsam Llc | $347,100 | Etitle Insurance Agency | |
| Downward Robert J | -- | Merrill Title |
Source: Public Records
Mortgage History
| Date | Status | Borrower | Loan Amount |
|---|---|---|---|
| Open | Eastman Aaron Reese | $361,250 | |
| Previous Owner | Downward Robert J | $144,290 |
Source: Public Records
Tax History Compared to Growth
Tax History
| Year | Tax Paid | Tax Assessment Tax Assessment Total Assessment is a certain percentage of the fair market value that is determined by local assessors to be the total taxable value of land and additions on the property. | Land | Improvement |
|---|---|---|---|---|
| 2025 | $2,877 | $557,300 | $152,400 | $404,900 |
| 2024 | $2,877 | $553,600 | $150,800 | $402,800 |
| 2023 | $2,899 | $525,600 | $142,300 | $383,300 |
| 2022 | $3,009 | $536,700 | $139,500 | $397,200 |
| 2021 | $2,548 | $413,800 | $108,500 | $305,300 |
| 2020 | $2,173 | $331,200 | $108,500 | $222,700 |
| 2019 | $2,144 | $320,400 | $102,300 | $218,100 |
| 2018 | $2,023 | $299,800 | $102,300 | $197,500 |
| 2017 | $1,813 | $267,600 | $102,300 | $165,300 |
| 2016 | $1,731 | $240,000 | $102,300 | $137,700 |
| 2015 | $1,795 | $242,600 | $108,200 | $134,400 |
| 2014 | $1,655 | $220,300 | $99,400 | $120,900 |
Source: Public Records
Map
Nearby Homes
- 4624 Pine Crossing Dr
- 4707 W Granada Hills Ct
- 8941 S Sun Leaf Dr
- 4904 Wild Acres Dr
- 9353 S 4460 W
- 5098 Cherry Laurel Ln
- 9332 S Wild Clover Ln
- 4887 W 8620 S
- 4565 Lennox Dr
- 8577 Autumn Gold Cir
- 9118 S Wisteria Way
- 9375 S Laurel Ridge Cir
- 8359 Etude Dr
- 4424 W Skye Dr
- 7903 Mckenzie Ln
- 7886 Mckenzie Ln
- 3931 W Dansere Cir
- 8854 Rocky Creek Dr
- 3888 W 8700 S
- 8322 Copper Vista Cir
- 4611 W Balsam Pine Dr
- 4599 Balsam Pine Dr
- 4627 W Balsam Pine Dr
- 4627 Balsam Pine Dr
- 8957 Black Pine St
- 8957 S Black Pine St
- 4604 Balsam Pine Dr
- 4604 W Balsam Pine Dr
- 4585 Balsam Pine Dr
- 9014 Goddard Cir
- 9015 S Goddard Cir
- 9015 Goddard Cir
- 4635 Balsam Pine Dr
- 9016 Goddard Cir
- 4588 Balsam Pine Dr
- 4588 W Balsam Pine Dr
- 9017 Goddard Cir
- 8964 Black Pine St
- 9018 Goddard Cir
- 8943 S Black Pine St