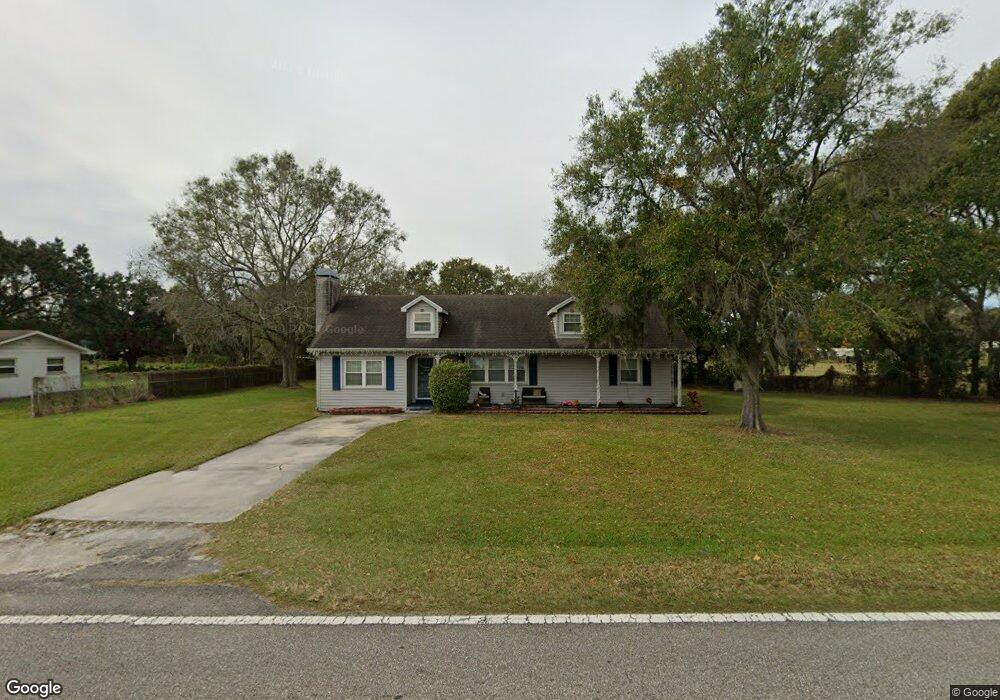
4611 Coronet Rd Plant City, FL 33566
Estimated Value: $280,506 - $340,000
3
Beds
1
Bath
1,372
Sq Ft
$219/Sq Ft
Est. Value
About This Home
This home is located at 4611 Coronet Rd, Plant City, FL 33566 and is currently estimated at $299,877, approximately $218 per square foot. 4611 Coronet Rd is a home located in Hillsborough County with nearby schools including Springhead Elementary School, Marshall Middle School, and Plant City High School.
Ownership History
Date
Name
Owned For
Owner Type
Purchase Details
Closed on
Sep 22, 2015
Sold by
Fannie Mae
Bought by
Paniagua Michael
Current Estimated Value
Home Financials for this Owner
Home Financials are based on the most recent Mortgage that was taken out on this home.
Original Mortgage
$122,735
Outstanding Balance
$95,870
Interest Rate
3.75%
Mortgage Type
FHA
Estimated Equity
$204,007
Purchase Details
Closed on
Jun 15, 2015
Sold by
Mcnary Glenda
Bought by
Federal National Mortgage Association
Purchase Details
Closed on
Aug 9, 2007
Sold by
Mcnary Glenda and Mcnary Edward
Bought by
Mcnary Glenda
Purchase Details
Closed on
Sep 17, 1993
Sold by
Cole Albert E
Bought by
Mcnary Edward R and Mcnary Glenda K
Home Financials for this Owner
Home Financials are based on the most recent Mortgage that was taken out on this home.
Original Mortgage
$41,885
Interest Rate
7.19%
Create a Home Valuation Report for This Property
The Home Valuation Report is an in-depth analysis detailing your home's value as well as a comparison with similar homes in the area
Home Values in the Area
Average Home Value in this Area
Purchase History
| Date | Buyer | Sale Price | Title Company |
|---|---|---|---|
| Paniagua Michael | $125,000 | Del Mar Title Services Llc | |
| Federal National Mortgage Association | -- | None Available | |
| Mcnary Glenda | -- | Attorney | |
| Mcnary Edward R | $16,300 | -- |
Source: Public Records
Mortgage History
| Date | Status | Borrower | Loan Amount |
|---|---|---|---|
| Open | Paniagua Michael | $122,735 | |
| Previous Owner | Mcnary Edward R | $41,885 |
Source: Public Records
Tax History Compared to Growth
Tax History
| Year | Tax Paid | Tax Assessment Tax Assessment Total Assessment is a certain percentage of the fair market value that is determined by local assessors to be the total taxable value of land and additions on the property. | Land | Improvement |
|---|---|---|---|---|
| 2024 | $3,865 | $199,402 | $50,837 | $148,565 |
| 2023 | $3,613 | $196,712 | $46,041 | $150,671 |
| 2022 | $3,296 | $185,043 | $39,807 | $145,236 |
| 2021 | $2,945 | $142,414 | $32,133 | $110,281 |
| 2020 | $2,750 | $134,556 | $30,934 | $103,622 |
| 2019 | $2,540 | $129,343 | $28,296 | $101,047 |
| 2018 | $2,380 | $119,934 | $0 | $0 |
| 2017 | $2,149 | $100,515 | $0 | $0 |
| 2016 | $2,077 | $95,562 | $0 | $0 |
| 2015 | $1,968 | $88,152 | $0 | $0 |
| 2014 | $1,928 | $86,389 | $0 | $0 |
| 2013 | -- | $83,941 | $0 | $0 |
Source: Public Records
Map
Nearby Homes
- 2407 Medulla Rd
- 2314 Howell Rd
- 2407 Coronet Rd
- 5211 Coronet Rd
- 2202 E Sparkman Rd
- 2509 E Sparkman Rd
- 2210 Tomberlin Grove Ln
- 0 Medulla Rd Unit MFRTB8431498
- 2812 Tom Brewer Ln
- 3101 Medulla Rd
- 2852 Tom Brewer Ln
- 2912 S Pineway Dr
- 3301 Medulla Rd
- 2906 N Willow Dr
- 3113 S Wiggins Rd
- 3011 S Wiggins Rd
- 3313 Rimes Rd
- 2908 S Wiggins Rd
- 2401 E Trapnell Rd
- 3329 Little Acre Ln
- 4613 Coronet Rd
- 4615 Coronet Rd
- 4703 Coronet Rd
- 2504 Medulla Rd
- 4706 Coronet Rd
- 2506 Medulla Rd
- 2625 Medulla Rd
- 4705 Coronet Rd
- 2403 Medulla Rd
- 2508 Medulla Rd
- 2602 Medulla Rd
- 4617 Coronet Rd
- 2304 Howell Rd
- 2118 Howell Rd
- 4709 Coronet Rd
- 4710 Coronet Rd
- 2604 Medulla Rd
- 2608 Medulla Rd
- 4802 Coronet Rd