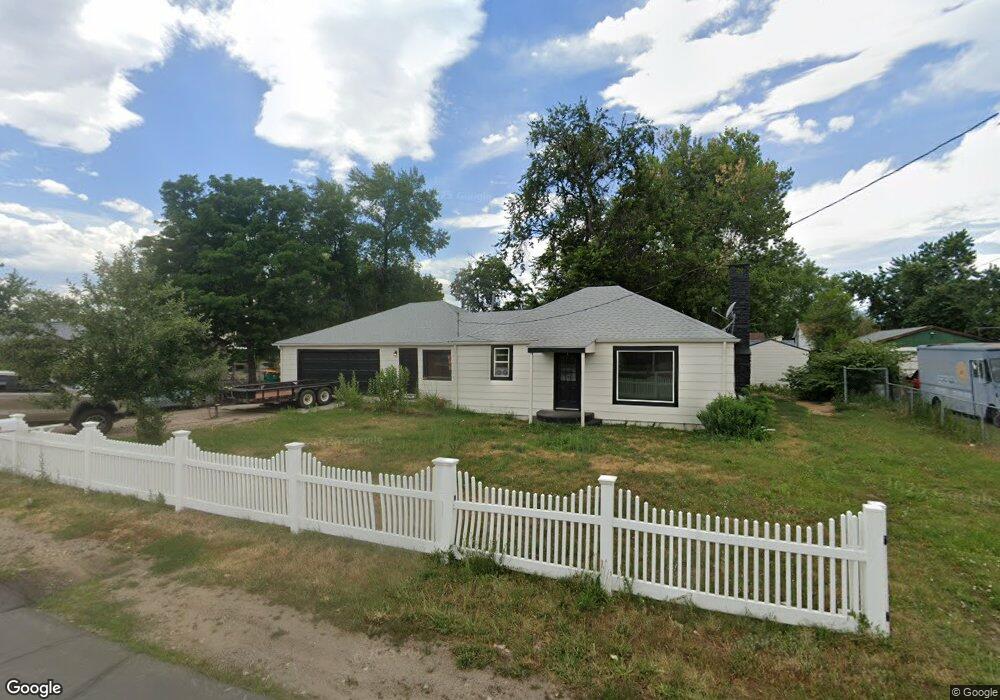
4611 Robb St Wheat Ridge, CO 80033
Fruitdale NeighborhoodEstimated Value: $398,000 - $565,481
2
Beds
3
Baths
1,714
Sq Ft
$294/Sq Ft
Est. Value
About This Home
This home is located at 4611 Robb St, Wheat Ridge, CO 80033 and is currently estimated at $503,870, approximately $293 per square foot. 4611 Robb St is a home located in Jefferson County with nearby schools including Kullerstrand Elementary School, Prospect Valley Elementary School, and Everitt Middle School.
Ownership History
Date
Name
Owned For
Owner Type
Purchase Details
Closed on
Apr 10, 2025
Sold by
Oconnor Hanlon
Bought by
All Star Bedrock Llc
Current Estimated Value
Home Financials for this Owner
Home Financials are based on the most recent Mortgage that was taken out on this home.
Original Mortgage
$738,750
Outstanding Balance
$735,540
Interest Rate
6.76%
Mortgage Type
New Conventional
Estimated Equity
-$231,670
Purchase Details
Closed on
Sep 11, 2024
Sold by
Abeyta Claude Jack
Bought by
All Star Bedrock Llc
Home Financials for this Owner
Home Financials are based on the most recent Mortgage that was taken out on this home.
Original Mortgage
$594,300
Interest Rate
6.73%
Mortgage Type
New Conventional
Purchase Details
Closed on
Mar 5, 2009
Sold by
Gannon Edgar L
Bought by
Gannon Edgar L and Alegta Claude Jack
Purchase Details
Closed on
Nov 21, 1989
Sold by
Public Service Company Of Colorado
Create a Home Valuation Report for This Property
The Home Valuation Report is an in-depth analysis detailing your home's value as well as a comparison with similar homes in the area
Home Values in the Area
Average Home Value in this Area
Purchase History
| Date | Buyer | Sale Price | Title Company |
|---|---|---|---|
| All Star Bedrock Llc | -- | None Listed On Document | |
| Oconnor Hanlon | -- | None Listed On Document | |
| All Star Bedrock Llc | $390,000 | Land Title | |
| Gannon Edgar L | -- | None Available | |
| -- | -- | -- |
Source: Public Records
Mortgage History
| Date | Status | Borrower | Loan Amount |
|---|---|---|---|
| Open | Oconnor Hanlon | $738,750 | |
| Previous Owner | All Star Bedrock Llc | $594,300 |
Source: Public Records
Tax History Compared to Growth
Tax History
| Year | Tax Paid | Tax Assessment Tax Assessment Total Assessment is a certain percentage of the fair market value that is determined by local assessors to be the total taxable value of land and additions on the property. | Land | Improvement |
|---|---|---|---|---|
| 2024 | $3,072 | $33,443 | $18,636 | $14,807 |
| 2023 | $3,072 | $33,443 | $18,636 | $14,807 |
| 2022 | $1,901 | $27,449 | $13,411 | $14,038 |
| 2021 | $1,931 | $28,239 | $13,797 | $14,442 |
| 2020 | $1,590 | $24,533 | $11,840 | $12,693 |
| 2019 | $1,568 | $24,533 | $11,840 | $12,693 |
| 2018 | $1,232 | $20,478 | $5,997 | $14,481 |
| 2017 | $1,123 | $20,478 | $5,997 | $14,481 |
| 2016 | $924 | $18,181 | $5,087 | $13,094 |
| 2015 | $610 | $18,181 | $5,087 | $13,094 |
| 2014 | $610 | $12,671 | $4,814 | $7,857 |
Source: Public Records
Map
Nearby Homes
- 4605 Quail St
- 4615 Quail St
- 11772 W 45th Place
- 11737 W 45th Place
- 4340 Pierson St
- 10640 W 46th Ave
- 10630 W 46th Ave
- 3935 Pierson St
- Plan 133 at Haskins Station
- Plan 132 at Haskins Station
- Plan 123 at Haskins Station
- Plan 122 at Haskins Station
- Haskins Station Plan at Haskins Station
- 5175 Simms Place
- 5182 Rob Way
- 5154 Taft Ct
- 11345 W 38th Ave
- 10251 W 44th Ave Unit 8-206
- 4040 Newman St
- 5240 Routt Ct Unit B