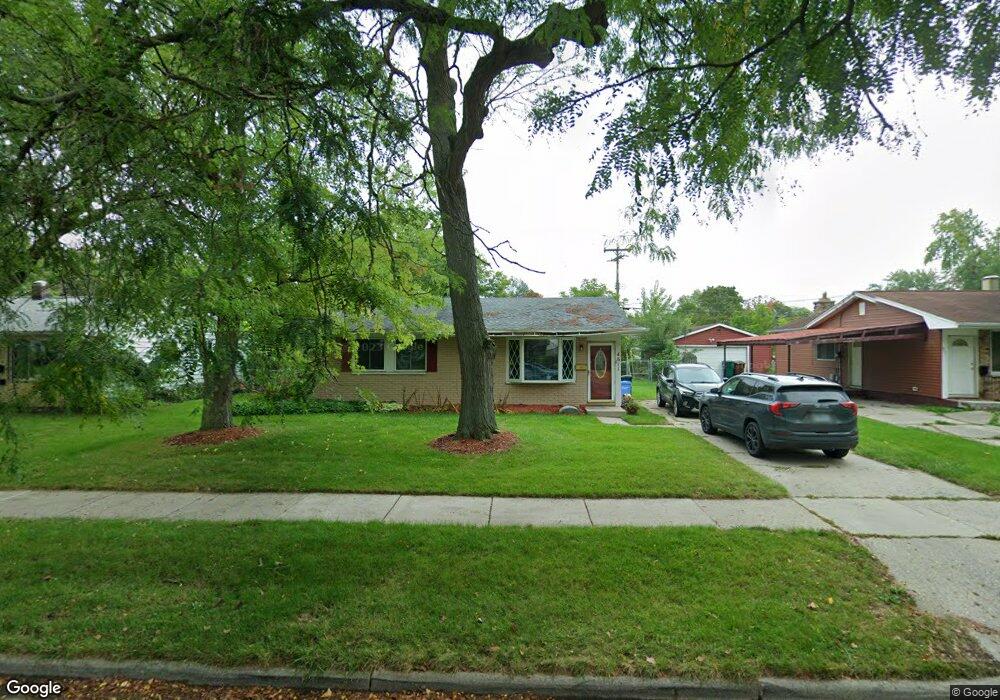
4611 Stillwell Ave Lansing, MI 48911
Churchill Downs NeighborhoodEstimated Value: $138,926 - $164,000
3
Beds
1
Bath
1,080
Sq Ft
$142/Sq Ft
Est. Value
About This Home
This home is located at 4611 Stillwell Ave, Lansing, MI 48911 and is currently estimated at $153,232, approximately $141 per square foot. 4611 Stillwell Ave is a home located in Ingham County with nearby schools including Reo Elementary School, Attwood School, and Everett High School.
Ownership History
Date
Name
Owned For
Owner Type
Purchase Details
Closed on
Jul 12, 2013
Sold by
Robbins Lori
Bought by
Milton Hershel and Milton Lavara
Current Estimated Value
Purchase Details
Closed on
Apr 29, 2010
Sold by
Robbins Lori
Bought by
Milton Hershel and Milton Laura
Purchase Details
Closed on
Dec 5, 2007
Sold by
Jackson Alphonso R
Bought by
Milton Hershel L and Milton Lavara D
Purchase Details
Closed on
Jun 22, 2006
Sold by
Countrywide Home Loans Inc
Bought by
Hud
Purchase Details
Closed on
Dec 15, 2005
Sold by
Beard Anjeanette and Anderson Scott L
Bought by
Countrywide Home Loans Inc
Purchase Details
Closed on
Apr 17, 2000
Sold by
Hud
Bought by
Beard Anjeanette and Anderson Scott L
Home Financials for this Owner
Home Financials are based on the most recent Mortgage that was taken out on this home.
Original Mortgage
$70,950
Interest Rate
8.64%
Mortgage Type
FHA
Purchase Details
Closed on
Dec 15, 1999
Sold by
Nationsbanc Mtg Corp
Bought by
Hud
Purchase Details
Closed on
Mar 19, 1999
Sold by
Parrott Mary Jo and Barkley Mary Jo Anne
Bought by
Nationsbanc Mtg Corp
Create a Home Valuation Report for This Property
The Home Valuation Report is an in-depth analysis detailing your home's value as well as a comparison with similar homes in the area
Home Values in the Area
Average Home Value in this Area
Purchase History
| Date | Buyer | Sale Price | Title Company |
|---|---|---|---|
| Milton Hershel | -- | None Available | |
| Milton Hershel | -- | None Available | |
| Milton Hershel L | $44,000 | Fat | |
| Hud | -- | None Available | |
| Countrywide Home Loans Inc | $73,211 | None Available | |
| Beard Anjeanette | $71,000 | -- | |
| Hud | -- | -- | |
| Nationsbanc Mtg Corp | $47,245 | -- |
Source: Public Records
Mortgage History
| Date | Status | Borrower | Loan Amount |
|---|---|---|---|
| Previous Owner | Beard Anjeanette | $70,950 |
Source: Public Records
Tax History Compared to Growth
Tax History
| Year | Tax Paid | Tax Assessment Tax Assessment Total Assessment is a certain percentage of the fair market value that is determined by local assessors to be the total taxable value of land and additions on the property. | Land | Improvement |
|---|---|---|---|---|
| 2025 | $3,050 | $60,000 | $8,700 | $51,300 |
| 2024 | $25 | $55,600 | $8,700 | $46,900 |
| 2023 | $2,870 | $49,000 | $8,700 | $40,300 |
| 2022 | $2,620 | $43,200 | $8,700 | $34,500 |
| 2021 | $2,559 | $39,100 | $5,500 | $33,600 |
| 2020 | $2,541 | $36,100 | $5,500 | $30,600 |
| 2019 | $2,456 | $34,500 | $5,500 | $29,000 |
| 2018 | $2,359 | $32,000 | $5,500 | $26,500 |
| 2017 | $2,273 | $32,000 | $5,500 | $26,500 |
| 2016 | $1,670 | $29,800 | $5,500 | $24,300 |
| 2015 | $1,670 | $29,100 | $10,970 | $18,130 |
| 2014 | $1,670 | $28,600 | $17,322 | $11,278 |
Source: Public Records
Map
Nearby Homes
- 3600 Ronald St
- 3115 Risdale Ave
- 5100 Wexford Rd
- 4809 Ballard Rd
- 4000 Churchill Ave
- 4828 Ingham St
- 4018 Clayborn Rd
- 2816 Greenbelt Dr
- 4328 Chadburne Dr
- 3006 Hillcrest St
- 4009 Heathgate Dr
- 2416 Midwood St
- 3100 Glenbrook Dr
- 2311 Greenbelt Dr
- 4110 Richmond St
- 4107 Windward Dr
- 4628 Pleasant Grove Rd
- 5424 S Waverly Rd
- 4317 Seaway Dr
- 3424 S Catherine St
- 4617 Stillwell Ave
- 4601 Stillwell Ave
- 4608 Atlanta Place
- 4623 Stillwell Ave
- 4614 Atlanta Place
- 4600 Atlanta Place
- 4620 Atlanta Place
- 4629 Stillwell Ave
- 4610 Stillwell Ave
- 4600 Stillwell Ave
- 4616 Stillwell Ave
- 4626 Atlanta Place
- 4521 Stillwell Ave
- 4620 Stillwell Ave
- 4633 Stillwell Ave
- 4626 Stillwell Ave
- 3320 Ronald St
- 4628 Atlanta Place
- 3301 Ronald St
- 4524 Stillwell Ave