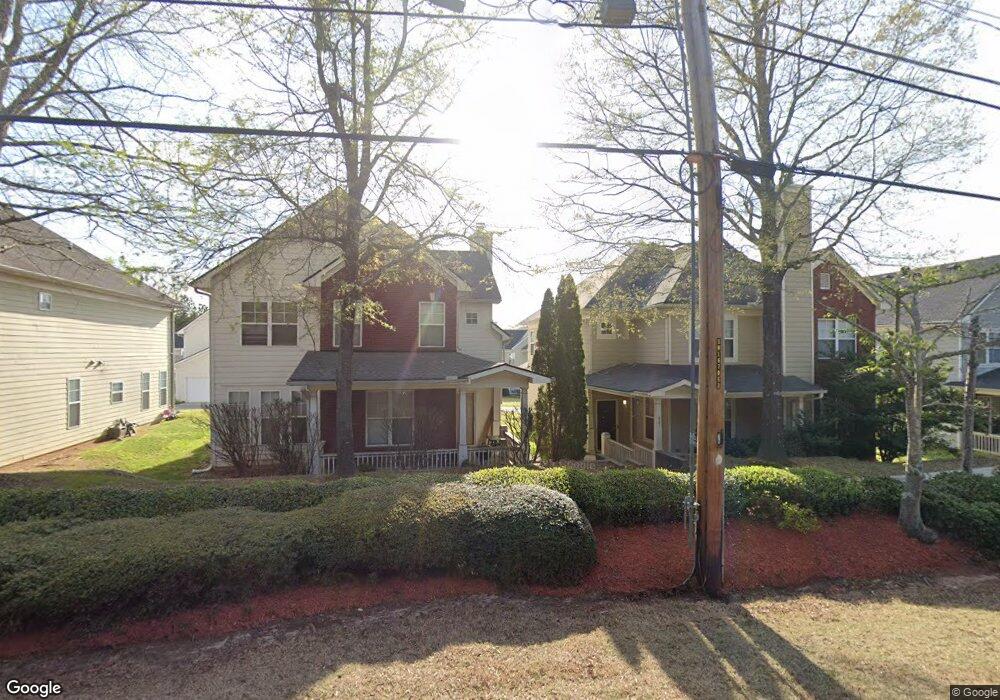
4612 Legacy Square Atlanta, GA 30349
Estimated Value: $271,000 - $305,000
4
Beds
3
Baths
2,280
Sq Ft
$124/Sq Ft
Est. Value
About This Home
This home is located at 4612 Legacy Square, Atlanta, GA 30349 and is currently estimated at $283,754, approximately $124 per square foot. 4612 Legacy Square is a home located in Fulton County with nearby schools including Lee Elementary School, Camp Creek Middle School, and Langston Hughes High School.
Ownership History
Date
Name
Owned For
Owner Type
Purchase Details
Closed on
Nov 3, 2016
Sold by
Tarbert Llc
Bought by
Csh 2016 2 Borrower Llc
Current Estimated Value
Purchase Details
Closed on
Sep 10, 2014
Sold by
Srp Sub Llc
Bought by
Tarbert Llc
Purchase Details
Closed on
Feb 4, 2014
Sold by
Abdul-Salaam Shadeed
Bought by
Srp Sub Llc
Purchase Details
Closed on
May 27, 2004
Sold by
Forrest Homes Inc
Bought by
Abdul-Salaam Ayisha and Abdul-Salaam Shaheed
Home Financials for this Owner
Home Financials are based on the most recent Mortgage that was taken out on this home.
Original Mortgage
$162,867
Interest Rate
6.09%
Mortgage Type
VA
Purchase Details
Closed on
Aug 27, 2003
Sold by
Forrest Homes Inc
Bought by
Abdul-Salaam Ayisha and Abdul-Salaam Shaheed
Home Financials for this Owner
Home Financials are based on the most recent Mortgage that was taken out on this home.
Original Mortgage
$162,867
Interest Rate
6.24%
Mortgage Type
FHA
Create a Home Valuation Report for This Property
The Home Valuation Report is an in-depth analysis detailing your home's value as well as a comparison with similar homes in the area
Home Values in the Area
Average Home Value in this Area
Purchase History
| Date | Buyer | Sale Price | Title Company |
|---|---|---|---|
| Csh 2016 2 Borrower Llc | -- | -- | |
| Tarbert Llc | -- | -- | |
| Srp Sub Llc | $82,000 | -- | |
| Abdul-Salaam Ayisha | $164,200 | -- | |
| Abdul-Salaam Ayisha | $164,200 | -- |
Source: Public Records
Mortgage History
| Date | Status | Borrower | Loan Amount |
|---|---|---|---|
| Previous Owner | Abdul-Salaam Ayisha | $162,867 | |
| Previous Owner | Abdul-Salaam Ayisha | $162,867 |
Source: Public Records
Tax History Compared to Growth
Tax History
| Year | Tax Paid | Tax Assessment Tax Assessment Total Assessment is a certain percentage of the fair market value that is determined by local assessors to be the total taxable value of land and additions on the property. | Land | Improvement |
|---|---|---|---|---|
| 2025 | $1,358 | $120,760 | $27,280 | $93,480 |
| 2023 | $2,711 | $96,040 | $16,840 | $79,200 |
| 2022 | $2,527 | $96,040 | $16,840 | $79,200 |
| 2021 | $3,088 | $73,760 | $14,160 | $59,600 |
| 2020 | $2,843 | $66,280 | $7,200 | $59,080 |
| 2019 | $944 | $62,040 | $6,280 | $55,760 |
| 2018 | $1,530 | $54,200 | $4,040 | $50,160 |
| 2017 | $1,224 | $41,960 | $11,840 | $30,120 |
| 2016 | $1,225 | $41,960 | $11,840 | $30,120 |
| 2015 | $1,969 | $41,960 | $11,840 | $30,120 |
| 2014 | $749 | $24,440 | $6,880 | $17,560 |
Source: Public Records
Map
Nearby Homes
- 4603 Parkway Cir
- 4658 Parkway Cir
- 200 Innesbrook Rd
- 4748 Highpoint Way
- 4544 Parkview Square
- 4764 Highpoint Way Unit 131
- 4567 Parkway Cir
- 4437 Ben Hill Rd
- 4709 Tradition Pkwy
- 4485 Spring Valley Pkwy
- 4050 Welcome All Terrace
- 3686 Thurman Rd
- 4090 Welcome All Terrace
- 3635 Sulene Dr
- 3690 Sulene Dr
- 3415 Spring Valley Blvd
- 4614 Legacy Square
- 4616 Legacy Square
- 4670 Parkway Cir
- 4666 Parkway Cir
- 4672 Parkway Cir
- 4203 Legacy Square
- 4205 Legacy Square
- 4613 Legacy Square
- 4615 Legacy Square
- 4207 Legacy Square
- 4664 Parkway Cir
- 4618 Legacy Square
- 4611 Legacy Square
- 4209 Legacy Square
- 4674 Parkway Cir
- 4617 Legacy Square
- 4662 Parkway Cir
- 4605 Parkway Cir
- 4211 Legacy Square
- 4619 Legacy Square