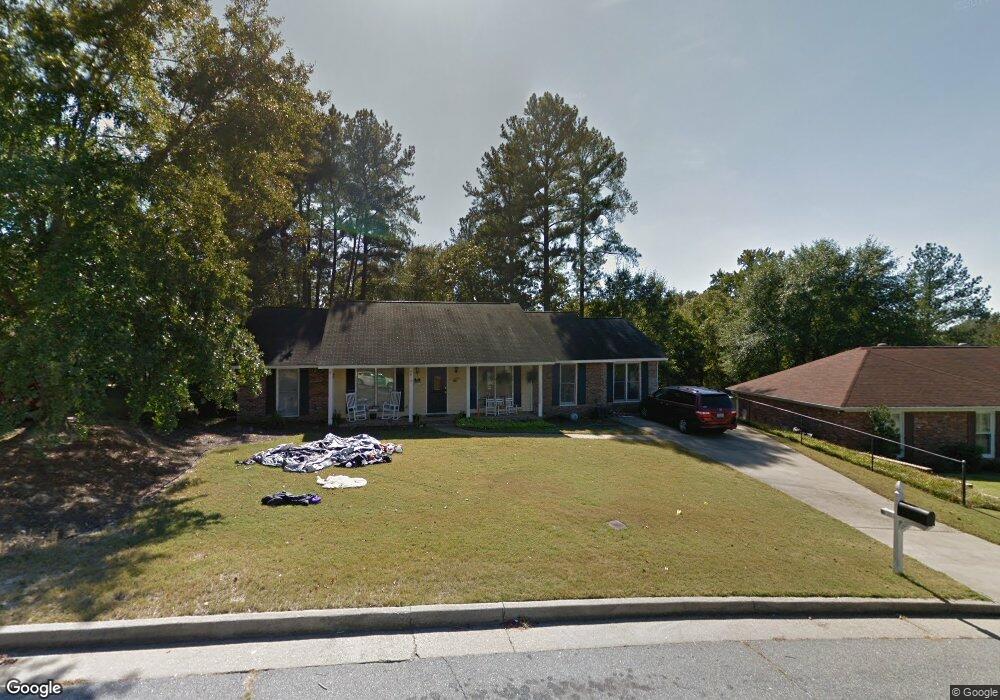
4612 Papaya Ct Columbus, GA 31909
Northern Columbus NeighborhoodEstimated Value: $245,000 - $268,000
3
Beds
2
Baths
1,972
Sq Ft
$129/Sq Ft
Est. Value
About This Home
This home is located at 4612 Papaya Ct, Columbus, GA 31909 and is currently estimated at $254,459, approximately $129 per square foot. 4612 Papaya Ct is a home located in Muscogee County with nearby schools including Eagle Ridge Academy, Blackmon Road Middle School, and Shaw High School.
Ownership History
Date
Name
Owned For
Owner Type
Purchase Details
Closed on
Feb 7, 2020
Sold by
Agyemang Antonio Kwame Afriyie
Bought by
Hughes Joshua M and Hughes Anne B
Current Estimated Value
Home Financials for this Owner
Home Financials are based on the most recent Mortgage that was taken out on this home.
Original Mortgage
$132,640
Outstanding Balance
$91,387
Interest Rate
3.6%
Mortgage Type
New Conventional
Estimated Equity
$163,072
Purchase Details
Closed on
Jun 28, 2016
Sold by
Gibson Christopher D
Bought by
Agyemang Antonio Kwame Afriyie and Agyemang Jasmine Sch Ia
Home Financials for this Owner
Home Financials are based on the most recent Mortgage that was taken out on this home.
Original Mortgage
$141,195
Interest Rate
3.25%
Mortgage Type
FHA
Create a Home Valuation Report for This Property
The Home Valuation Report is an in-depth analysis detailing your home's value as well as a comparison with similar homes in the area
Home Values in the Area
Average Home Value in this Area
Purchase History
| Date | Buyer | Sale Price | Title Company |
|---|---|---|---|
| Hughes Joshua M | $165,800 | -- | |
| Agyemang Antonio Kwame Afriyie | $143,800 | -- |
Source: Public Records
Mortgage History
| Date | Status | Borrower | Loan Amount |
|---|---|---|---|
| Open | Hughes Joshua M | $132,640 | |
| Previous Owner | Agyemang Antonio Kwame Afriyie | $141,195 |
Source: Public Records
Tax History Compared to Growth
Tax History
| Year | Tax Paid | Tax Assessment Tax Assessment Total Assessment is a certain percentage of the fair market value that is determined by local assessors to be the total taxable value of land and additions on the property. | Land | Improvement |
|---|---|---|---|---|
| 2025 | $2,006 | $81,800 | $10,952 | $70,848 |
| 2024 | $2,004 | $81,800 | $10,952 | $70,848 |
| 2023 | $132 | $81,800 | $10,952 | $70,848 |
| 2022 | $2,090 | $64,904 | $10,952 | $53,952 |
| 2021 | $2,084 | $64,420 | $10,952 | $53,468 |
| 2020 | $1,710 | $55,248 | $10,952 | $44,296 |
| 2019 | $1,717 | $55,248 | $10,952 | $44,296 |
| 2018 | $2,264 | $55,248 | $10,952 | $44,296 |
| 2017 | $2,364 | $57,520 | $10,760 | $46,760 |
| 2016 | $1,874 | $58,704 | $7,770 | $50,934 |
| 2015 | $1,877 | $58,704 | $7,770 | $50,934 |
| 2014 | $1,880 | $58,704 | $7,770 | $50,934 |
| 2013 | -- | $58,704 | $7,770 | $50,934 |
Source: Public Records
Map
Nearby Homes
- 6630 Lemans Ln
- 4715 Teak Dr
- 209 Plum Ct
- 5011 Montego Dr
- 5041 Montego Dr
- 6736 Charter Oaks Cir
- 6500 Charter Oaks Cir
- 4627 Wimbish Ct
- 5042 Foxfire Dr
- 5045 Old Post Rd
- 4417 Sibley St
- 6528 Yellow Stone Ct
- 5378 Misty Ln
- 4245 N Oaks Dr
- 6137 Stoneway Dr
- 6136 Morningside Dr
- 6333 Stony Creek Dr
- 7020 Stoneridge Cir
- 7076 Stoneybrook Dr
- 6263 Potomac Cir
- 4620 Papaya Ct
- 4606 Papaya Ct
- 4813 Sequoia Dr
- 4805 Sequoia Dr
- 4628 Papaya Ct
- 4821 Sequoia Dr
- 4735 Sequoia Dr
- 4600 Papaya Ct
- 4613 Papaya Ct
- 6664 Lemans Ln
- 4727 Sequoia Dr
- 4827 Sequoia Dr
- 6676 Lemans Ln
- 0 Sequoia Dr Unit 8687801
- 0 Sequoia Dr Unit 7540863
- 6658 Lemans Ln
- 4621 Papaya Ct
- 4636 Papaya Ct
- 4901 Sequoia Dr
- 4719 Sequoia Dr