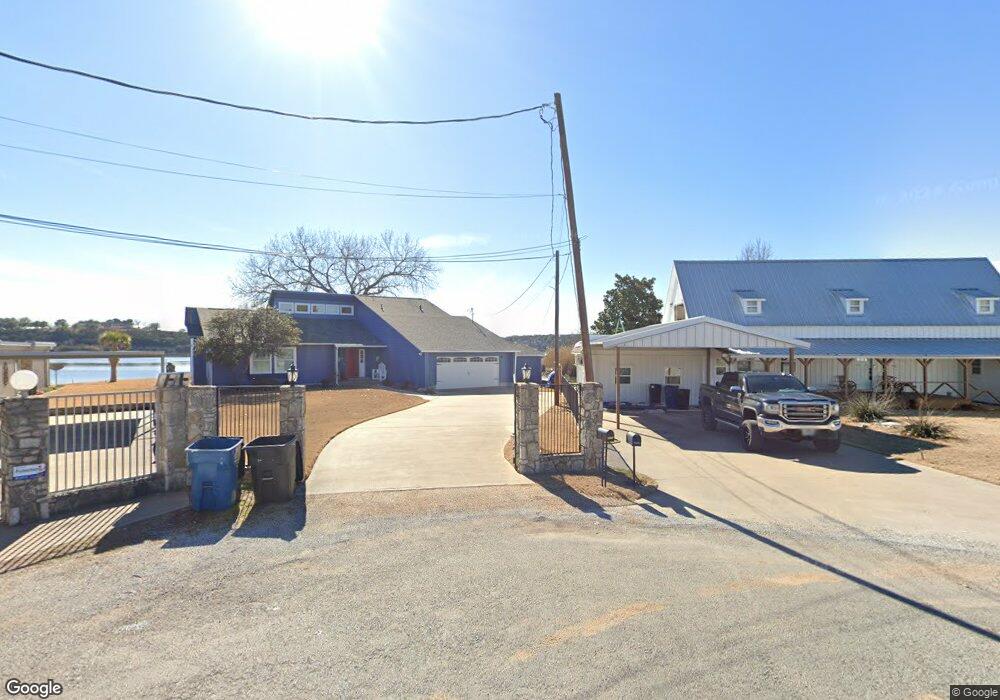
4612 Retreat Ct Granbury, TX 76049
Estimated Value: $539,288 - $718,000
3
Beds
3
Baths
2,130
Sq Ft
$303/Sq Ft
Est. Value
About This Home
This home is located at 4612 Retreat Ct, Granbury, TX 76049 and is currently estimated at $645,072, approximately $302 per square foot. 4612 Retreat Ct is a home located in Hood County with nearby schools including Acton Elementary School, Acton Middle School, and Granbury High School.
Ownership History
Date
Name
Owned For
Owner Type
Purchase Details
Closed on
Mar 31, 2018
Sold by
Stanley Mike and Stanley Regina
Bought by
Rife Bryan and Rife Katherine
Current Estimated Value
Home Financials for this Owner
Home Financials are based on the most recent Mortgage that was taken out on this home.
Original Mortgage
$300,000
Outstanding Balance
$257,198
Interest Rate
4.4%
Mortgage Type
New Conventional
Estimated Equity
$387,874
Purchase Details
Closed on
Jun 3, 2016
Sold by
Knieper Pamela T
Bought by
Stanley Mike and Stanley Regina
Purchase Details
Closed on
Mar 3, 2015
Sold by
Williams Barbara Ann
Bought by
Equity Trust Company
Purchase Details
Closed on
Sep 14, 2012
Sold by
Kelleher Michael James
Bought by
Stanley Mike Et Ux Regina
Purchase Details
Closed on
Sep 12, 2011
Sold by
Kelleher Patrick C
Bought by
Stanley Mike Et Ux Regina
Purchase Details
Closed on
Feb 15, 1989
Bought by
Stanley Mike Et Ux Regina
Create a Home Valuation Report for This Property
The Home Valuation Report is an in-depth analysis detailing your home's value as well as a comparison with similar homes in the area
Home Values in the Area
Average Home Value in this Area
Purchase History
| Date | Buyer | Sale Price | Title Company |
|---|---|---|---|
| Rife Bryan | -- | Chicago Title Of Texas Llc | |
| Stanley Mike | -- | Porter Title Company | |
| Equity Trust Company | $304,857 | None Available | |
| Stanley Mike Et Ux Regina | -- | -- | |
| Stanley Mike Et Ux Regina | -- | -- | |
| Stanley Mike Et Ux Regina | -- | -- |
Source: Public Records
Mortgage History
| Date | Status | Borrower | Loan Amount |
|---|---|---|---|
| Open | Rife Bryan | $300,000 |
Source: Public Records
Tax History Compared to Growth
Tax History
| Year | Tax Paid | Tax Assessment Tax Assessment Total Assessment is a certain percentage of the fair market value that is determined by local assessors to be the total taxable value of land and additions on the property. | Land | Improvement |
|---|---|---|---|---|
| 2025 | $4,847 | $501,073 | $245,000 | $433,660 |
| 2024 | $4,497 | $455,521 | $245,000 | $446,800 |
| 2023 | $5,039 | $645,980 | $245,000 | $400,980 |
| 2022 | $4,609 | $579,270 | $205,000 | $374,270 |
| 2021 | $5,254 | $342,240 | $160,000 | $182,240 |
| 2020 | $5,143 | $331,150 | $160,000 | $171,150 |
| 2019 | $5,384 | $331,150 | $160,000 | $171,150 |
| 2018 | $5,000 | $307,560 | $160,000 | $147,560 |
| 2017 | $4,677 | $279,710 | $160,000 | $119,710 |
| 2016 | $4,471 | $267,380 | $152,000 | $115,380 |
| 2015 | $4,481 | $259,990 | $136,000 | $123,990 |
| 2014 | $4,481 | $292,770 | $136,000 | $156,770 |
Source: Public Records
Map
Nearby Homes
- 4603 Rendezvous Ct
- 4604 E Holiday Estates Ct
- 4309 Davis Rd
- 4561 Jackson Bend Ct
- 3708 Coral Sands Ct
- 4415 Jackson Ln
- 741 R C Luker Ct
- 735 R C Luker Ct
- 729 R C Luker Ct
- 723 R C Luker Ct
- 2802 River Ridge Ct
- 8088 Brownie Luker Blvd
- 3711 Indian Creek Trail
- 717 R C Luker Ct
- 724 Rc Luker Ct
- 3211 Boynton Ave
- 3211 Boynton Ave Unit 3209
- 3713 Indian Creek Trail
- 718 R C Luker Ct
- 9042 Brownie Luker Blvd
- 4614 Retreat Ct
- 4610 Retreat Ct
- 4608 Retreat Ct
- 4606 Retreat Ct
- 4611 Retreat Ct
- 4607 Retreat Ct
- 4604 Retreat Ct
- 4604 Retreat Ct
- 4605 Retreat Ct
- 4614 Rendezvous Ct
- 4612 Rendezvous Ct
- 4608 Rendezvous Ct
- 3637 W Holiday Estates Ct
- 4606 Rendezvous Ct
- 4604 Rendezvous Ct
- 4616 Rendezvous Ct
- 4602 Rendezvous Ct
- 3629 W Holiday Estates Ct
- 4617 Rendezvous Ct
- 4611 Rendezvous Ct