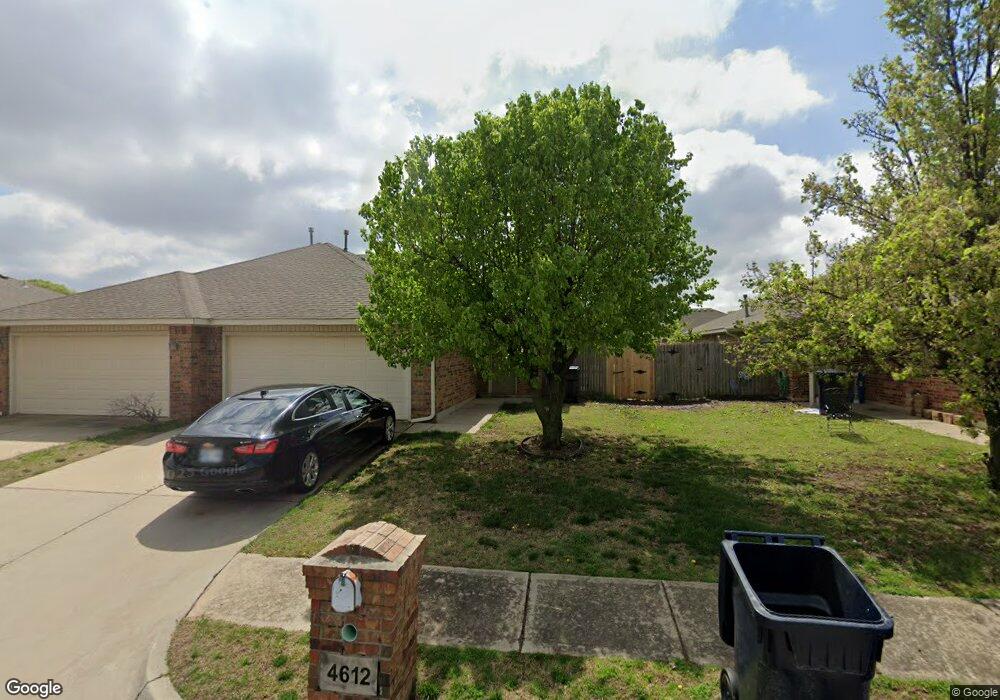
4612 SE 77th St Oklahoma City, OK 73135
Lumberman NeighborhoodEstimated Value: $129,000 - $424,000
3
Beds
2
Baths
1,219
Sq Ft
$223/Sq Ft
Est. Value
About This Home
This home is located at 4612 SE 77th St, Oklahoma City, OK 73135 and is currently estimated at $272,309, approximately $223 per square foot. 4612 SE 77th St is a home located in Oklahoma County with nearby schools including Parkview Elementary School, Kerr Middle School, and Rice Challenge Academy.
Ownership History
Date
Name
Owned For
Owner Type
Purchase Details
Closed on
Jul 13, 2021
Sold by
Macleod Cheryl L and Cheryl L Macleod Separate Prop
Bought by
Bryga Michael N and Macleod Cheryl L
Current Estimated Value
Purchase Details
Closed on
May 30, 2013
Sold by
Mcleod Cheryl L and Mcleod Cheryl L
Bought by
Macleod Cheryl L and The Cheryl L Macleod Separate Property T
Purchase Details
Closed on
Mar 12, 2013
Sold by
Macleod Ian R
Bought by
Mcleod Cheryl L
Purchase Details
Closed on
Mar 13, 2006
Sold by
Macleod Cheryl L
Bought by
Macleod Cheryl L and Macleod Ian R
Home Financials for this Owner
Home Financials are based on the most recent Mortgage that was taken out on this home.
Original Mortgage
$21,750
Interest Rate
6.21%
Mortgage Type
Credit Line Revolving
Create a Home Valuation Report for This Property
The Home Valuation Report is an in-depth analysis detailing your home's value as well as a comparison with similar homes in the area
Home Values in the Area
Average Home Value in this Area
Purchase History
| Date | Buyer | Sale Price | Title Company |
|---|---|---|---|
| Bryga Michael N | -- | None Available | |
| Macleod Cheryl L | -- | None Available | |
| Mcleod Cheryl L | -- | The Oklahoma City Abstract | |
| Macleod Cheryl L | -- | Lawyers Title Of Ok City Inc | |
| Macleod Cheryl L | $218,000 | Lawyers Title Of Ok City Inc |
Source: Public Records
Mortgage History
| Date | Status | Borrower | Loan Amount |
|---|---|---|---|
| Previous Owner | Macleod Cheryl L | $21,750 | |
| Previous Owner | Macleod Cheryl L | $174,300 |
Source: Public Records
Tax History Compared to Growth
Tax History
| Year | Tax Paid | Tax Assessment Tax Assessment Total Assessment is a certain percentage of the fair market value that is determined by local assessors to be the total taxable value of land and additions on the property. | Land | Improvement |
|---|---|---|---|---|
| 2024 | $1,438 | $12,283 | $1,811 | $10,472 |
| 2023 | $1,438 | $11,699 | $1,719 | $9,980 |
| 2022 | $1,360 | $11,141 | $1,602 | $9,539 |
| 2021 | $1,324 | $10,611 | $1,774 | $8,837 |
| 2020 | $1,296 | $10,106 | $2,152 | $7,954 |
| 2019 | $1,201 | $9,625 | $2,858 | $6,767 |
| 2018 | $1,309 | $10,490 | $0 | $0 |
| 2017 | $1,262 | $9,990 | $2,807 | $7,183 |
| 2016 | $1,226 | $9,514 | $2,157 | $7,357 |
| 2015 | $1,190 | $9,134 | $2,046 | $7,088 |
| 2014 | $1,128 | $8,699 | $2,157 | $6,542 |
Source: Public Records
Map
Nearby Homes
- 4508 SE 77th St
- 4701 SE 81st St
- 4708 SE 81st St
- 4544 SE 81st St
- 5109 SE 80th St
- 8404 Pinewood Dr
- 4836 SE 85th Terrace
- 4313 SE 86th St
- 8401 Azurewood Dr
- 5508 SE 80th St
- 8108 Bigwood Dr
- 5105 SE 86th St
- 8701 Woodbend Dr
- 8709 Woodbend Dr
- 4900 SE 88th Terrace
- 5305 SE 85th St
- 4701 S Sooner Rd
- 5401 SE 86th St
- 8001 John Robert Dr
- 8005 John Robert Dr
- 4614 SE 77th St
- 4610 SE 77th St
- 4608 SE 77th St
- 4616 SE 77th St
- 4618 SE 77th St
- 4617 SE 78th St
- 4606 SE 77th St
- 4621 SE 78th St
- 4625 SE 78th St
- 4700 SE 77th St
- 4604 SE 77th St
- 4609 SE 78th St
- 4615 SE 77th St
- 4611 SE 77th St
- 4629 SE 78th St
- 4613 SE 77th St
- 4602 SE 77th St
- 4702 SE 77th St
- 4609 SE 77th St