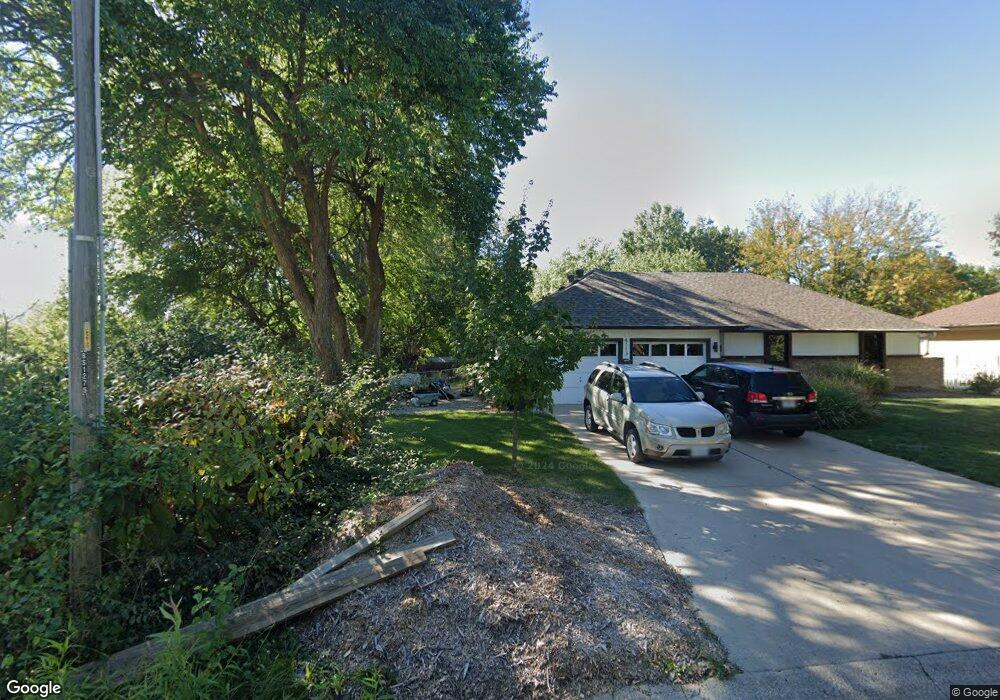
4613 SW 9th Street Ct Blue Springs, MO 64015
Estimated Value: $345,000 - $402,000
3
Beds
3
Baths
1,710
Sq Ft
$214/Sq Ft
Est. Value
About This Home
This home is located at 4613 SW 9th Street Ct, Blue Springs, MO 64015 and is currently estimated at $365,142, approximately $213 per square foot. 4613 SW 9th Street Ct is a home located in Jackson County with nearby schools including Cordill-Mason Elementary School, Moreland Ridge Middle School, and Blue Springs South High School.
Ownership History
Date
Name
Owned For
Owner Type
Purchase Details
Closed on
Mar 25, 2024
Sold by
Theen Robert E and Theen Sylvia M
Bought by
Theen Robert E
Current Estimated Value
Purchase Details
Closed on
Jul 30, 2008
Sold by
Kallstrom Donald L and Kallstrom Jacqueline G
Bought by
Theen Robert E and Theen Sylvia M
Purchase Details
Closed on
Mar 9, 1998
Sold by
Gieseke Steven K and Gieseke Catherine D
Bought by
Baker Larry D and Baker Matthew D
Home Financials for this Owner
Home Financials are based on the most recent Mortgage that was taken out on this home.
Original Mortgage
$25,133
Interest Rate
7.01%
Mortgage Type
Construction
Purchase Details
Closed on
Jul 25, 1997
Sold by
Kay Hale Sandra
Bought by
Gieseke Steven K and Gieseke Catherine D
Purchase Details
Closed on
Oct 4, 1996
Sold by
George T Ward Builders Inc
Bought by
Hale Sandra Kay
Home Financials for this Owner
Home Financials are based on the most recent Mortgage that was taken out on this home.
Original Mortgage
$16,400
Interest Rate
7.43%
Mortgage Type
Purchase Money Mortgage
Create a Home Valuation Report for This Property
The Home Valuation Report is an in-depth analysis detailing your home's value as well as a comparison with similar homes in the area
Home Values in the Area
Average Home Value in this Area
Purchase History
| Date | Buyer | Sale Price | Title Company |
|---|---|---|---|
| Theen Robert E | -- | None Listed On Document | |
| Theen Robert E | -- | Cbkc Title & Escrow Llc | |
| Baker Larry D | -- | Stewart Title | |
| Gieseke Steven K | -- | Stewart Title | |
| Hale Sandra Kay | -- | -- |
Source: Public Records
Mortgage History
| Date | Status | Borrower | Loan Amount |
|---|---|---|---|
| Previous Owner | Baker Larry D | $25,133 | |
| Previous Owner | Hale Sandra Kay | $16,400 |
Source: Public Records
Tax History Compared to Growth
Tax History
| Year | Tax Paid | Tax Assessment Tax Assessment Total Assessment is a certain percentage of the fair market value that is determined by local assessors to be the total taxable value of land and additions on the property. | Land | Improvement |
|---|---|---|---|---|
| 2025 | $3,833 | $55,174 | $8,147 | $47,027 |
| 2024 | $3,833 | $47,979 | $7,387 | $40,592 |
| 2023 | $3,756 | $47,979 | $6,496 | $41,483 |
| 2022 | $4,041 | $45,410 | $5,786 | $39,624 |
| 2021 | $3,806 | $45,410 | $5,786 | $39,624 |
| 2020 | $3,458 | $39,608 | $5,786 | $33,822 |
| 2019 | $3,359 | $39,608 | $5,786 | $33,822 |
| 2018 | $916,788 | $36,332 | $4,990 | $31,342 |
| 2017 | $3,185 | $36,332 | $4,990 | $31,342 |
| 2016 | $3,113 | $35,644 | $5,776 | $29,868 |
| 2014 | $2,897 | $32,863 | $5,780 | $27,083 |
Source: Public Records
Map
Nearby Homes
- 4716 SW 6th Terrace
- 4712 SW 6th Terrace
- 505 SW Newport Dr
- 509 SW Newport Dr
- 500 SW Chelmsford Dr
- 1205 SW Southgate Dr
- 305 SW Nelson Dr
- 4000 SW 9th St
- 217 SW Chelmsford Dr
- 220 SW Chelmsford Dr
- The Magnolia Plan at Eagles Ridge - Garden Collection
- The Gardenia Plan at Eagles Ridge - Garden Collection
- Starlight Plan at Eagles Ridge
- Serenade Plan at Eagles Ridge - Bliss Collection
- Serenity Plan at Eagles Ridge - Bliss Collection
- Oasis Plan at Eagles Ridge - Bliss Collection
- Harmony Plan at Eagles Ridge - Bliss Collection
- Devotion Plan at Eagles Ridge - Bliss Collection
- Lexington Plan at Eagles Ridge - Premier Collection
- Brookside Plan at Eagles Ridge - Premier Collection
- 4617 SW 9th Street Ct
- 910 SW Hillcrest Ln
- 4701 SW 9th Street Ct
- 903 SW Hillcrest Ln
- 4616 SW 10th St
- 4620 SW 10th St
- 4616 SW 9th Street Ct
- 4612 SW 9th Street Ct
- 817 SW Hillcrest Ln
- 907 SW Hillcrest Ln
- 4700 SW 10th St
- 813 SW Hillcrest Ln
- 4705 SW 9th Street Ct
- 4700 SW 10 St
- 4700 SW 9th Street Ct
- 4706 SW 9th Street Ct
- 4604 SW 10th St
- 4704 SW 9th Street Ct
- 809 SW Hillcrest Ln
- 4617 SW 10th St