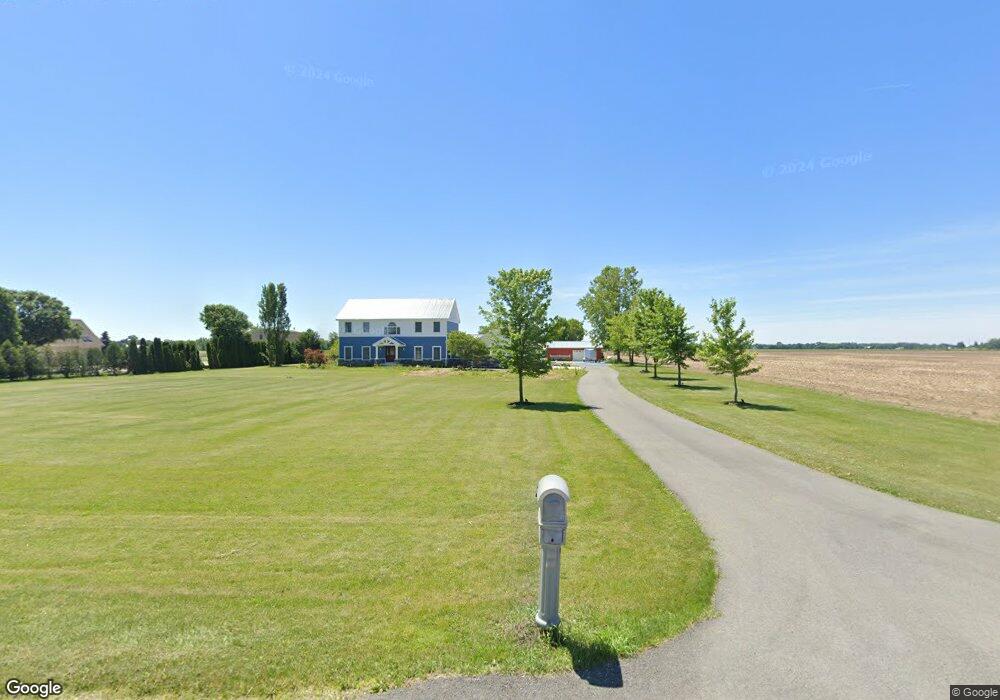
4613 Swan Rd Pemberville, OH 43450
Estimated Value: $409,000 - $454,000
4
Beds
3
Baths
2,492
Sq Ft
$173/Sq Ft
Est. Value
About This Home
This home is located at 4613 Swan Rd, Pemberville, OH 43450 and is currently estimated at $431,920, approximately $173 per square foot. 4613 Swan Rd is a home located in Wood County with nearby schools including Pemberville Elementary School, Eastwood Middle School, and Eastwood High School.
Ownership History
Date
Name
Owned For
Owner Type
Purchase Details
Closed on
Feb 28, 2005
Sold by
Cannon Daniel L and Cannon Jill A
Bought by
Ruck J Douglas and Contris Ruck Lisa M
Current Estimated Value
Home Financials for this Owner
Home Financials are based on the most recent Mortgage that was taken out on this home.
Original Mortgage
$220,000
Outstanding Balance
$112,272
Interest Rate
5.71%
Mortgage Type
Purchase Money Mortgage
Estimated Equity
$319,648
Purchase Details
Closed on
Jun 28, 2000
Sold by
Vanek Russell G and Vanek Marilyn J
Bought by
Cannon Daniel L and Cannon Jill A
Home Financials for this Owner
Home Financials are based on the most recent Mortgage that was taken out on this home.
Original Mortgage
$39,000
Interest Rate
8.66%
Purchase Details
Closed on
Oct 16, 1998
Sold by
Vanek Marilyn J and Vanek Russell G
Bought by
Vanek Russell G and Vanek Marilyn J
Create a Home Valuation Report for This Property
The Home Valuation Report is an in-depth analysis detailing your home's value as well as a comparison with similar homes in the area
Home Values in the Area
Average Home Value in this Area
Purchase History
| Date | Buyer | Sale Price | Title Company |
|---|---|---|---|
| Ruck J Douglas | $245,000 | -- | |
| Cannon Daniel L | $39,000 | -- | |
| Vanek Russell G | -- | -- |
Source: Public Records
Mortgage History
| Date | Status | Borrower | Loan Amount |
|---|---|---|---|
| Open | Ruck J Douglas | $220,000 | |
| Previous Owner | Cannon Daniel L | $39,000 |
Source: Public Records
Tax History Compared to Growth
Tax History
| Year | Tax Paid | Tax Assessment Tax Assessment Total Assessment is a certain percentage of the fair market value that is determined by local assessors to be the total taxable value of land and additions on the property. | Land | Improvement |
|---|---|---|---|---|
| 2024 | $4,809 | $123,690 | $23,940 | $99,750 |
| 2023 | $4,809 | $122,850 | $23,940 | $98,910 |
| 2021 | $4,119 | $96,080 | $20,900 | $75,180 |
| 2020 | $4,161 | $96,080 | $20,900 | $75,180 |
| 2019 | $3,492 | $81,590 | $18,450 | $63,140 |
| 2018 | $3,485 | $81,590 | $18,450 | $63,140 |
| 2017 | $3,091 | $81,590 | $18,450 | $63,140 |
| 2016 | $2,724 | $69,300 | $18,830 | $50,470 |
| 2015 | $2,724 | $69,300 | $18,830 | $50,470 |
| 2014 | $3,076 | $69,300 | $18,830 | $50,470 |
| 2013 | $3,305 | $69,300 | $18,830 | $50,470 |
Source: Public Records
Map
Nearby Homes