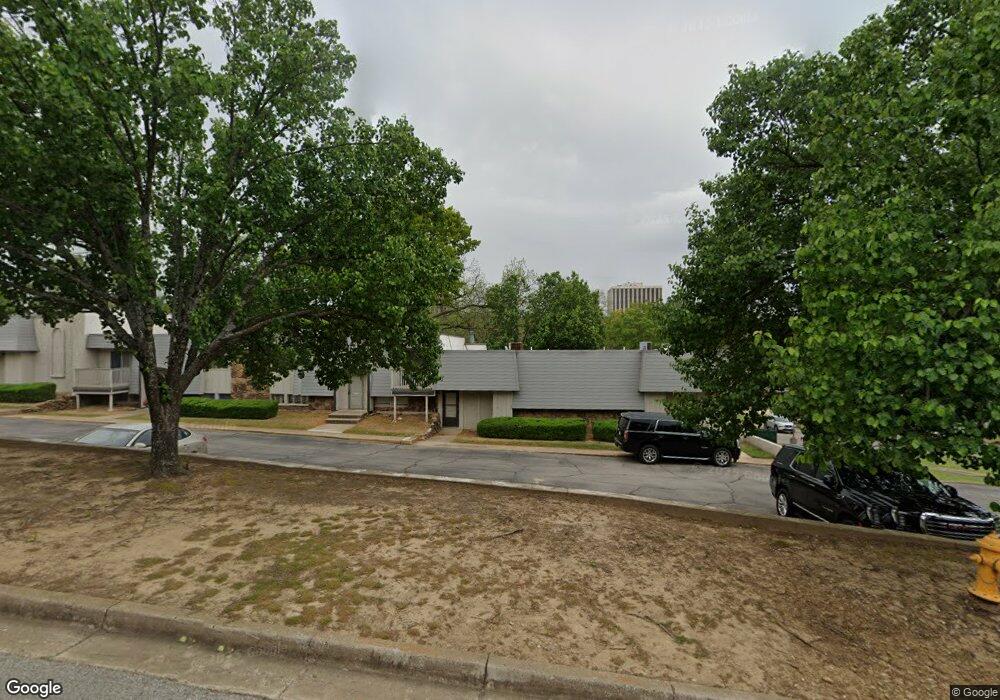
4614 E 68th St Unit A2 Tulsa, OK 74136
Livingston Park NeighborhoodEstimated Value: $103,000 - $118,000
Studio
2
Baths
1,402
Sq Ft
$78/Sq Ft
Est. Value
About This Home
This home is located at 4614 E 68th St Unit A2, Tulsa, OK 74136 and is currently estimated at $109,185, approximately $77 per square foot. 4614 E 68th St Unit A2 is a home located in Tulsa County with nearby schools including Jenks Middle School, Jenks West Intermediate Elementary School, and Jenks High School.
Ownership History
Date
Name
Owned For
Owner Type
Purchase Details
Closed on
Aug 29, 2023
Sold by
Brasuell Elaine C and Brasuell Steven
Bought by
Ge Zhen
Current Estimated Value
Purchase Details
Closed on
Jul 27, 2022
Sold by
Vannoort Elaine C and Brasuell Elaine C
Bought by
Brasuell Elaine C and Brasuell Van Noort
Purchase Details
Closed on
Jul 20, 2022
Sold by
Chavez Martha I
Bought by
Brasuell Elaine C
Purchase Details
Closed on
Jul 23, 2007
Sold by
Chavez Martha I
Bought by
Smith Tommy B
Purchase Details
Closed on
Sep 11, 2006
Sold by
R L Holding Llc
Bought by
Chavez Martha I
Home Financials for this Owner
Home Financials are based on the most recent Mortgage that was taken out on this home.
Original Mortgage
$51,250
Interest Rate
6.64%
Mortgage Type
Purchase Money Mortgage
Purchase Details
Closed on
Aug 1, 1985
Create a Home Valuation Report for This Property
The Home Valuation Report is an in-depth analysis detailing your home's value as well as a comparison with similar homes in the area
Home Values in the Area
Average Home Value in this Area
Purchase History
| Date | Buyer | Sale Price | Title Company |
|---|---|---|---|
| Ge Zhen | $125,000 | First American Title Insurance | |
| Brasuell Elaine C | -- | None Listed On Document | |
| Brasuell Elaine C | $100,000 | Community Title Services | |
| Smith Tommy B | -- | None Available | |
| Chavez Martha I | $68,500 | None Available | |
| -- | $59,000 | -- |
Source: Public Records
Mortgage History
| Date | Status | Borrower | Loan Amount |
|---|---|---|---|
| Previous Owner | Chavez Martha I | $51,250 |
Source: Public Records
Tax History
| Year | Tax Paid | Tax Assessment Tax Assessment Total Assessment is a certain percentage of the fair market value that is determined by local assessors to be the total taxable value of land and additions on the property. | Land | Improvement |
|---|---|---|---|---|
| 2025 | $1,521 | $10,758 | $1,463 | $9,295 |
| 2024 | $1,465 | $13,750 | $1,463 | $12,287 |
| 2023 | $1,465 | $11,000 | $1,463 | $9,537 |
| 2022 | $897 | $6,535 | $1,269 | $5,266 |
| 2021 | $910 | $6,535 | $1,269 | $5,266 |
| 2020 | $890 | $6,535 | $1,269 | $5,266 |
| 2019 | $921 | $6,535 | $1,269 | $5,266 |
| 2018 | $920 | $6,535 | $1,269 | $5,266 |
| 2017 | $898 | $7,535 | $1,463 | $6,072 |
| 2016 | $902 | $7,535 | $1,463 | $6,072 |
| 2015 | $919 | $7,535 | $1,463 | $6,072 |
| 2014 | $916 | $7,535 | $1,463 | $6,072 |
Source: Public Records
Map
Nearby Homes
- 4720 E 68th St Unit 260
- 4812 E 68th St Unit 107
- 4606 E 68th St Unit 123
- 4614 E 68th St Unit 119
- 4624 E 68th St Unit 114
- 4670 E 68th St Unit 173
- 4670 E 68th St Unit 273
- 4640 E 68th St Unit 183
- 4860 E 68th St Unit 136
- 4894 E 68th St Unit 147
- 6804 S Toledo Ave Unit 404
- 4446 E 68th St Unit 392
- 4444 E 68th St Unit 390
- 4444 E 68th St Unit 490
- 4406 E 68th St Unit 472
- 4342 E 67th St Unit 694
- 4336 E 67th St Unit 689
- 4333 E 68th St Unit C2-604
- 4334 E 67th St Unit 687
- 4326 E 67th St Unit 679
- 4608 E 68th St Unit A2
- 4604 E 68th St Unit A2
- 4624 E 68th St Unit A2
- 4610 E 68th St Unit A2
- 4606 E 68th St Unit A2
- 4620 E 68th St Unit A2
- 4616 E 68th St Unit A2
- 4602 E 68th St Unit A2
- 4612 E 68th St Unit A2
- 4618 E 68th St Unit A2
- 4622 E 68th St Unit A2
- 4616 E 68th St Unit 118 - A2
- 4610 E 68th St Unit 121/A2
- 4610 E 68th St Unit 121 BLD A2
- 4602 E 68th St Unit N
- 4604 E 68th St Unit 124-A2
- 4620 E 68th St Unit 116 - A2
- 4606 E 68th St Unit 123 BLD A2
- 4608 E 68th St Unit 122
- 4616 E 68th St Unit 118
Your Personal Tour Guide
Ask me questions while you tour the home.