Estimated Value: $379,000 - $450,000
4
Beds
2
Baths
2,100
Sq Ft
$194/Sq Ft
Est. Value
About This Home
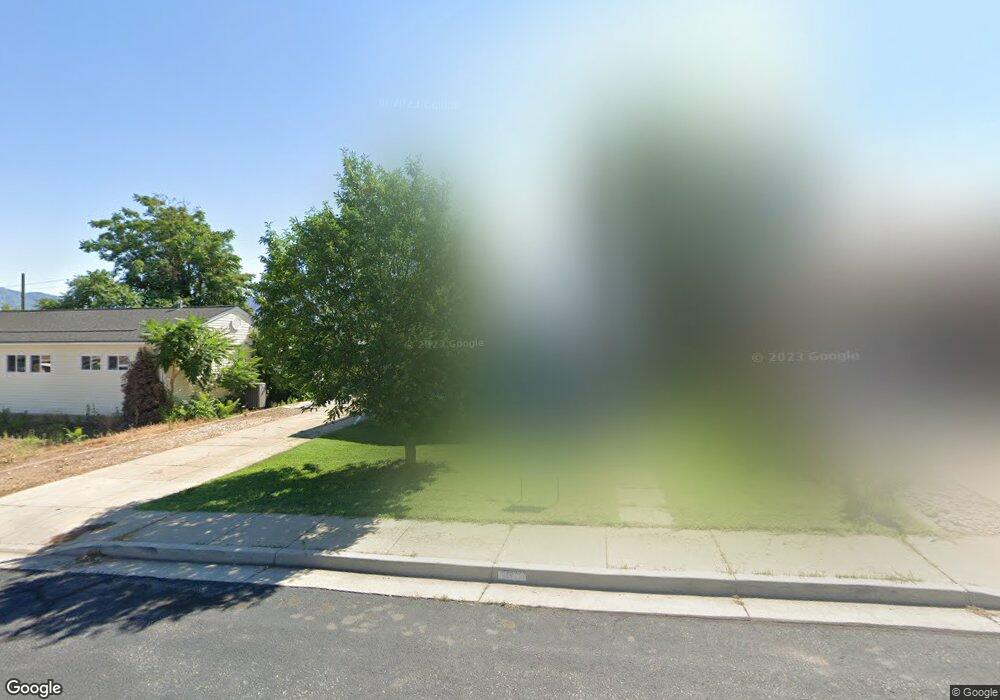
This home is located at 4614 S 400 W, Ogden, UT 84405 and is currently estimated at $407,712, approximately $194 per square foot. 4614 S 400 W is a home located in Weber County with nearby schools including Washington Terrace School, T.H. Bell Junior High School, and Bonneville High School.
Ownership History
Date
Name
Owned For
Owner Type
Purchase Details
Closed on
Oct 24, 2023
Sold by
Fjp Properties Llc
Bought by
Saxton Cameron and Saxton Scott
Current Estimated Value
Home Financials for this Owner
Home Financials are based on the most recent Mortgage that was taken out on this home.
Original Mortgage
$391,875
Outstanding Balance
$384,256
Interest Rate
7.18%
Mortgage Type
New Conventional
Estimated Equity
$23,456
Purchase Details
Closed on
Apr 14, 2023
Sold by
Olson Marlin Lynn
Bought by
Fjp Properties Llc
Home Financials for this Owner
Home Financials are based on the most recent Mortgage that was taken out on this home.
Original Mortgage
$280,350
Interest Rate
6.65%
Mortgage Type
New Conventional
Purchase Details
Closed on
Jun 20, 2019
Sold by
Klema Janet F and Olson Janet Faye Klema
Bought by
Faye Klema Janet and Olson Marlin Lynn
Create a Home Valuation Report for This Property
The Home Valuation Report is an in-depth analysis detailing your home's value as well as a comparison with similar homes in the area
Home Values in the Area
Average Home Value in this Area
Purchase History
| Date | Buyer | Sale Price | Title Company |
|---|---|---|---|
| Saxton Cameron | -- | Gt Title Services | |
| Fjp Properties Llc | -- | Stewart Title | |
| Faye Klema Janet | -- | First American Title |
Source: Public Records
Mortgage History
| Date | Status | Borrower | Loan Amount |
|---|---|---|---|
| Open | Saxton Cameron | $391,875 | |
| Previous Owner | Fjp Properties Llc | $280,350 |
Source: Public Records
Tax History Compared to Growth
Tax History
| Year | Tax Paid | Tax Assessment Tax Assessment Total Assessment is a certain percentage of the fair market value that is determined by local assessors to be the total taxable value of land and additions on the property. | Land | Improvement |
|---|---|---|---|---|
| 2025 | $2,550 | $377,805 | $110,006 | $267,799 |
| 2024 | $2,418 | $201,299 | $60,503 | $140,796 |
| 2023 | $3,726 | $327,000 | $109,870 | $217,130 |
| 2022 | $2,310 | $361,000 | $105,000 | $256,000 |
| 2021 | $1,762 | $242,000 | $54,991 | $187,009 |
| 2020 | $1,706 | $214,000 | $45,055 | $168,945 |
| 2019 | $1,627 | $188,000 | $45,055 | $142,945 |
| 2018 | $1,416 | $158,000 | $45,055 | $112,945 |
| 2017 | $1,324 | $137,000 | $29,990 | $107,010 |
| 2016 | $1,192 | $66,315 | $16,560 | $49,755 |
| 2015 | $1,208 | $66,315 | $16,560 | $49,755 |
| 2014 | $1,194 | $65,093 | $16,560 | $48,533 |
Source: Public Records
Map
Nearby Homes
- 4598 S 450 W
- 358 W 4575 S
- 4617 S 450 W
- 396 W 4675 S
- 4506 S 300 W
- 4610 S 250 W
- 235 W 4600 S
- 193 W 4650 S
- 4360 S 275 W
- 4856 S 300 W
- 4931 S 300 W
- 4375 Weber River Dr Unit 44
- 4375 Weber River Dr Unit 123
- 4375 Weber River Dr Unit 55
- 203 W 4900 S Unit 3
- 246 W 5000 S
- 390 W 5050 S
- 480 W 5050 S
- 4375 S Weber River Dr Unit 68
- 493 W 5100 S