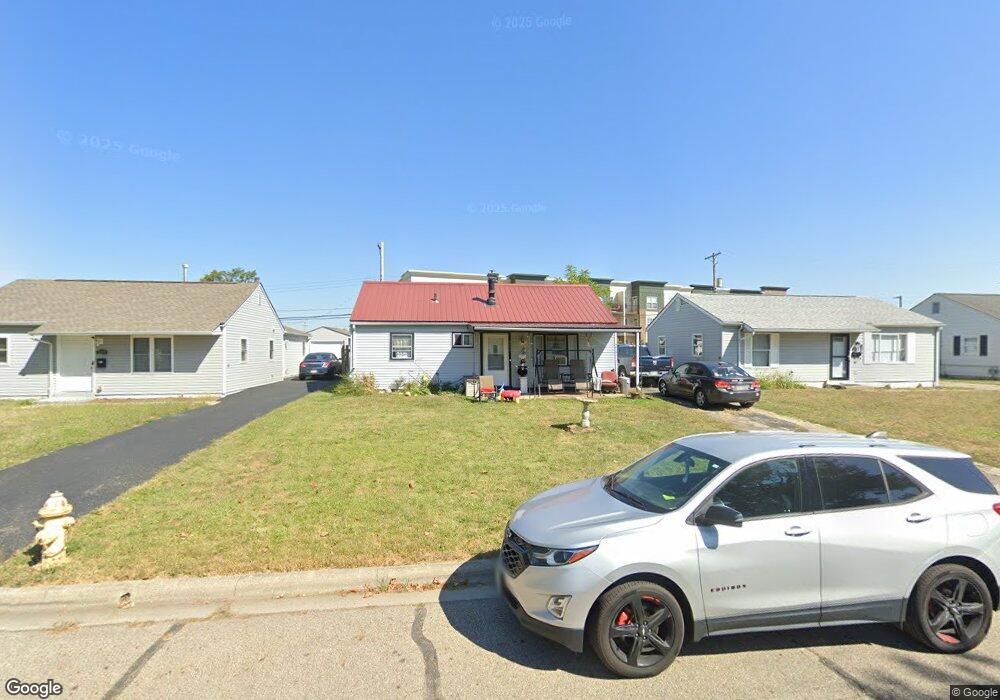
4614 St Francis Ln Columbus, OH 43213
Estimated Value: $171,000 - $196,000
3
Beds
1
Bath
1,386
Sq Ft
$134/Sq Ft
Est. Value
About This Home
This home is located at 4614 St Francis Ln, Columbus, OH 43213 and is currently estimated at $186,370, approximately $134 per square foot. 4614 St Francis Ln is a home located in Franklin County with nearby schools including Etna Road Elementary School, Beechwood Elementary School, and Rosemore Middle School.
Ownership History
Date
Name
Owned For
Owner Type
Purchase Details
Closed on
Sep 14, 2015
Sold by
Wilkinson Kyle A
Bought by
Fleming Chris and Fleming Lori
Current Estimated Value
Home Financials for this Owner
Home Financials are based on the most recent Mortgage that was taken out on this home.
Original Mortgage
$79,541
Outstanding Balance
$62,474
Interest Rate
3.91%
Mortgage Type
VA
Estimated Equity
$123,896
Purchase Details
Closed on
Apr 14, 2015
Sold by
Wilkinson Kyle A and Glanemann Barbara
Bought by
Wilkinson Kyle A
Home Financials for this Owner
Home Financials are based on the most recent Mortgage that was taken out on this home.
Original Mortgage
$48,300
Interest Rate
3.77%
Mortgage Type
New Conventional
Purchase Details
Closed on
May 31, 1995
Sold by
Mcdonald Weston B
Bought by
Wilkinson Kyle A and Wilkinson Barbara D
Home Financials for this Owner
Home Financials are based on the most recent Mortgage that was taken out on this home.
Original Mortgage
$57,500
Interest Rate
8.26%
Mortgage Type
New Conventional
Create a Home Valuation Report for This Property
The Home Valuation Report is an in-depth analysis detailing your home's value as well as a comparison with similar homes in the area
Home Values in the Area
Average Home Value in this Area
Purchase History
| Date | Buyer | Sale Price | Title Company |
|---|---|---|---|
| Fleming Chris | $77,000 | Attorney | |
| Wilkinson Kyle A | $5,000 | Nationallink | |
| Wilkinson Kyle A | $57,500 | -- |
Source: Public Records
Mortgage History
| Date | Status | Borrower | Loan Amount |
|---|---|---|---|
| Open | Fleming Chris | $79,541 | |
| Closed | Wilkinson Kyle A | $48,300 | |
| Closed | Wilkinson Kyle A | $57,500 |
Source: Public Records
Tax History Compared to Growth
Tax History
| Year | Tax Paid | Tax Assessment Tax Assessment Total Assessment is a certain percentage of the fair market value that is determined by local assessors to be the total taxable value of land and additions on the property. | Land | Improvement |
|---|---|---|---|---|
| 2024 | $2,312 | $52,890 | $13,090 | $39,800 |
| 2023 | $2,296 | $52,885 | $13,090 | $39,795 |
| 2022 | $1,355 | $23,730 | $5,040 | $18,690 |
| 2021 | $1,273 | $23,730 | $5,040 | $18,690 |
| 2020 | $1,260 | $23,730 | $5,040 | $18,690 |
| 2019 | $1,129 | $18,490 | $4,030 | $14,460 |
| 2018 | $1,229 | $18,490 | $4,030 | $14,460 |
| 2017 | $1,194 | $18,490 | $4,030 | $14,460 |
| 2016 | $1,297 | $19,850 | $3,960 | $15,890 |
| 2015 | $1,308 | $19,850 | $3,960 | $15,890 |
| 2014 | $1,308 | $19,850 | $3,960 | $15,890 |
| 2013 | $690 | $22,015 | $4,375 | $17,640 |
Source: Public Records
Map
Nearby Homes
- 4489 Saint Margaret Ln
- 4368 Broadhurst Dr
- 353 Shell Ct E
- 451 Beaver Ave
- 4232 Mayflower Blvd
- 424 Cumberland Dr
- 571 S Hamilton Rd
- 322 Fairway Cir
- 469 Cumberland Dr
- 4780 Etna Rd Unit 782
- 4148 Elbern Ave
- 579 Westphal Ave
- 4653 Kae Ave
- 547 Country Club Rd
- 110 Ironclad Dr Unit 9
- 4662 Jae Ave
- 185 Prairiecreek Way Unit 185
- 91 Robinwood Ave
- 686 Fairway Blvd
- 798 S Yearling Rd
- 4614 Saint Francis Ln
- 4608 Saint Francis Ln
- 4626 Saint Francis Ln
- 4600 St Francis Ln
- 4600 Saint Francis Ln
- 4634 Saint Francis Ln
- 4598 Saint Francis Ln
- 116 Patricia Ln
- 4617 Saint Francis Ln
- 4623 Saint Francis Ln
- 4623 St Francis Ln
- 4640 Saint Francis Ln
- 4596 Saint Francis Ln
- 4629 Saint Francis Ln
- 4629 St Francis Ln
- 122 Patricia Ln
- 4635 Saint Francis Ln
- 4648 Saint Francis Ln
- 115 Patricia Ln
- 4592 Saint Francis Ln