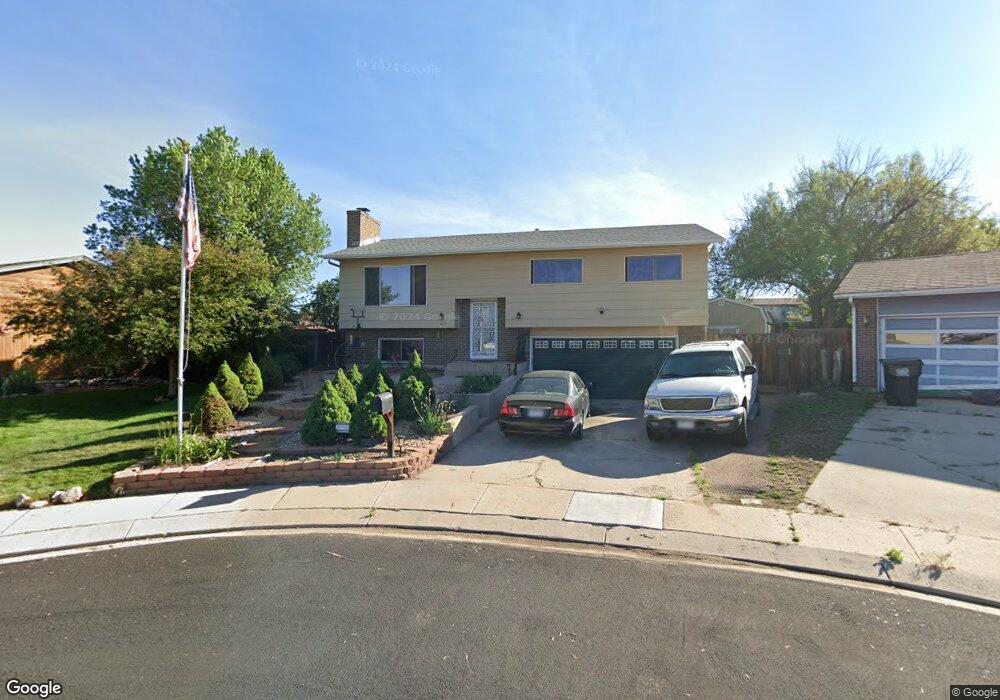
4615 Ranch Cir Colorado Springs, CO 80918
Garden Ranch NeighborhoodEstimated Value: $399,000 - $417,000
3
Beds
2
Baths
1,125
Sq Ft
$362/Sq Ft
Est. Value
About This Home
This home is located at 4615 Ranch Cir, Colorado Springs, CO 80918 and is currently estimated at $407,666, approximately $362 per square foot. 4615 Ranch Cir is a home located in El Paso County with nearby schools including Grant Elementary School, Mann Middle School, and Mitchell High School.
Ownership History
Date
Name
Owned For
Owner Type
Purchase Details
Closed on
Jun 29, 2020
Sold by
Tuffley Lawrence J
Bought by
Swift Joseph H
Current Estimated Value
Home Financials for this Owner
Home Financials are based on the most recent Mortgage that was taken out on this home.
Original Mortgage
$310,800
Outstanding Balance
$276,108
Interest Rate
3.2%
Mortgage Type
VA
Estimated Equity
$131,558
Purchase Details
Closed on
Mar 3, 2000
Sold by
Brennan Michael T and Brennan Jody R
Bought by
Tuffley Lawrence J
Home Financials for this Owner
Home Financials are based on the most recent Mortgage that was taken out on this home.
Original Mortgage
$118,450
Interest Rate
8.29%
Mortgage Type
VA
Purchase Details
Closed on
Jul 21, 1992
Bought by
Tuffley Lawrence J
Purchase Details
Closed on
Aug 1, 1984
Bought by
Tuffley Lawrence J
Purchase Details
Closed on
Mar 1, 1979
Bought by
Tuffley Lawrence J
Create a Home Valuation Report for This Property
The Home Valuation Report is an in-depth analysis detailing your home's value as well as a comparison with similar homes in the area
Home Values in the Area
Average Home Value in this Area
Purchase History
| Date | Buyer | Sale Price | Title Company |
|---|---|---|---|
| Swift Joseph H | $300,000 | Capital Title | |
| Tuffley Lawrence J | $115,000 | Stewart Title | |
| Tuffley Lawrence J | $67,900 | -- | |
| Tuffley Lawrence J | -- | -- | |
| Tuffley Lawrence J | -- | -- |
Source: Public Records
Mortgage History
| Date | Status | Borrower | Loan Amount |
|---|---|---|---|
| Open | Swift Joseph H | $310,800 | |
| Previous Owner | Tuffley Lawrence J | $118,450 |
Source: Public Records
Tax History Compared to Growth
Tax History
| Year | Tax Paid | Tax Assessment Tax Assessment Total Assessment is a certain percentage of the fair market value that is determined by local assessors to be the total taxable value of land and additions on the property. | Land | Improvement |
|---|---|---|---|---|
| 2025 | $1,245 | $27,530 | -- | -- |
| 2024 | $1,133 | $26,810 | $4,820 | $21,990 |
| 2022 | $1,133 | $20,250 | $3,610 | $16,640 |
| 2021 | $1,230 | $20,840 | $3,720 | $17,120 |
| 2020 | $1,165 | $17,170 | $3,220 | $13,950 |
| 2019 | $1,159 | $17,170 | $3,220 | $13,950 |
| 2018 | $1,045 | $14,240 | $2,160 | $12,080 |
| 2017 | $990 | $14,240 | $2,160 | $12,080 |
| 2016 | $809 | $13,960 | $2,230 | $11,730 |
| 2015 | $806 | $13,960 | $2,230 | $11,730 |
| 2014 | $757 | $12,580 | $2,230 | $10,350 |
Source: Public Records
Map
Nearby Homes
- 4623 Ranch Cir
- 5034 El Camino Dr Unit 36
- 5034 El Camino Dr Unit 31
- 5034 El Camino Dr Unit 42
- 5030 El Camino Dr Unit 8
- 5030 El Camino Dr Unit 1
- 2832 Ridgeglen Way
- 4454 Ranch Cir
- 5015 Bonita Way
- 4911 Sonata Dr
- 4518 Misty Dr
- 4434 Misty Dr
- 5140 Villa Cir
- 4886 Sonata Dr Unit C
- 5139 Villa Cir
- 4858 Sonata Dr Unit D
- 5127 Galena Dr
- 4410 Moonlight Dr
- 4506 Ridgecrest Dr
- 2775 El Capitan Dr
- 4619 Ranch Cir
- 4611 Ranch Cir
- 4607 Ranch Cir
- 4606 Ridgeglen Rd
- 4610 Ranch Cir
- 4627 Ranch Cir
- 4620 Ranch Cir
- 4602 Ridgeglen Rd
- 4603 Ranch Cir
- 4606 Ranch Cir
- 4624 Ranch Cir
- 4610 Ridgeglen Rd
- 4631 Ranch Cir
- 4610R Ridgeglen Rd
- 4528 Ridgeglen Rd
- 5034 El Camino Dr Unit 38
- 5034 El Camino Dr Unit 40
- 5034 El Camino Dr Unit 43
- 5034 El Camino Dr Unit 45
- 5034 El Camino Dr Unit 47