Estimated Value: $282,757 - $337,000
3
Beds
4
Baths
1,922
Sq Ft
$162/Sq Ft
Est. Value
About This Home
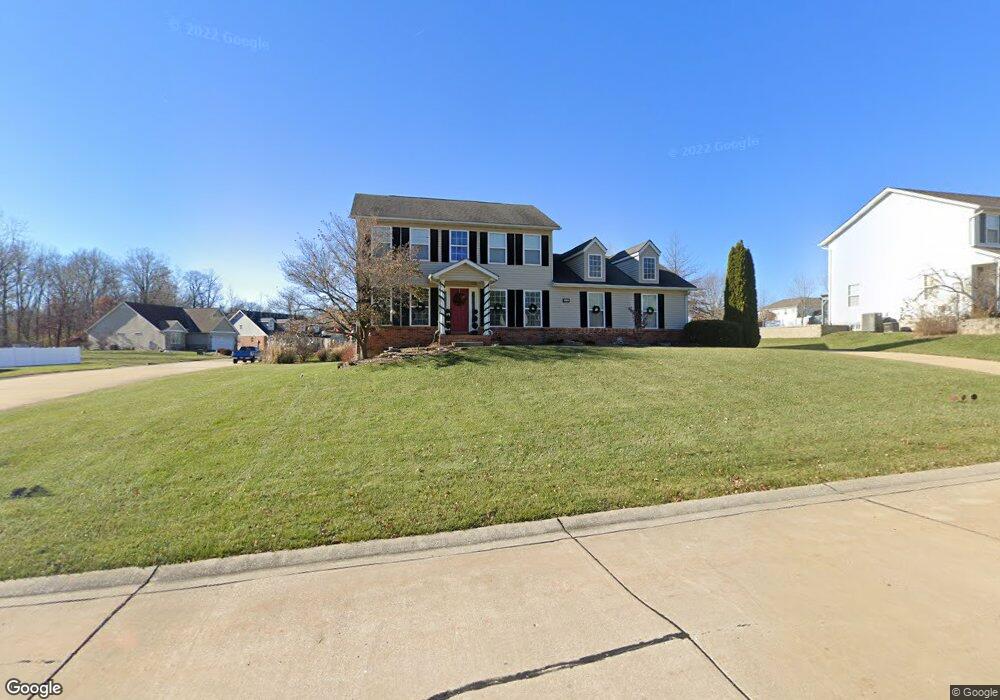
This home is located at 4616 Camellia Place, Alton, IL 62002 and is currently estimated at $311,689, approximately $162 per square foot. 4616 Camellia Place is a home located in Madison County with nearby schools including Eunice Smith Elementary School, Alton Middle School, and Alton High School.
Ownership History
Date
Name
Owned For
Owner Type
Purchase Details
Closed on
Jan 18, 2013
Sold by
Zink Christopher J and Zink Jamie L
Bought by
Cowan Joel P and Cowan Jennifer A
Current Estimated Value
Home Financials for this Owner
Home Financials are based on the most recent Mortgage that was taken out on this home.
Original Mortgage
$169,000
Outstanding Balance
$117,176
Interest Rate
3.31%
Mortgage Type
New Conventional
Estimated Equity
$194,513
Purchase Details
Closed on
Mar 16, 2005
Sold by
Meridian Land Co
Bought by
Zink Christopher J and Zink Jamie L
Home Financials for this Owner
Home Financials are based on the most recent Mortgage that was taken out on this home.
Original Mortgage
$157,840
Interest Rate
5.12%
Mortgage Type
Fannie Mae Freddie Mac
Create a Home Valuation Report for This Property
The Home Valuation Report is an in-depth analysis detailing your home's value as well as a comparison with similar homes in the area
Home Values in the Area
Average Home Value in this Area
Purchase History
| Date | Buyer | Sale Price | Title Company |
|---|---|---|---|
| Cowan Joel P | $189,000 | Serenity Title & Escrow Ltd | |
| Zink Christopher J | $69,500 | Community Title & Escrow Ltd |
Source: Public Records
Mortgage History
| Date | Status | Borrower | Loan Amount |
|---|---|---|---|
| Open | Cowan Joel P | $169,000 | |
| Previous Owner | Zink Christopher J | $157,840 | |
| Closed | Zink Christopher J | $39,460 |
Source: Public Records
Tax History Compared to Growth
Tax History
| Year | Tax Paid | Tax Assessment Tax Assessment Total Assessment is a certain percentage of the fair market value that is determined by local assessors to be the total taxable value of land and additions on the property. | Land | Improvement |
|---|---|---|---|---|
| 2024 | $5,359 | $85,480 | $14,800 | $70,680 |
| 2023 | $5,359 | $78,910 | $13,660 | $65,250 |
| 2022 | $5,086 | $72,160 | $12,490 | $59,670 |
| 2021 | $4,606 | $67,870 | $11,750 | $56,120 |
| 2020 | $4,515 | $66,410 | $11,500 | $54,910 |
| 2019 | $4,614 | $64,680 | $11,200 | $53,480 |
| 2018 | $4,538 | $61,920 | $10,720 | $51,200 |
| 2017 | $4,330 | $61,920 | $10,720 | $51,200 |
| 2016 | $4,206 | $61,920 | $10,720 | $51,200 |
| 2015 | $3,771 | $59,970 | $10,380 | $49,590 |
| 2014 | $3,771 | $59,970 | $10,380 | $49,590 |
| 2013 | $3,771 | $59,970 | $10,380 | $49,590 |
Source: Public Records
Map
Nearby Homes
- 0 Happy Ct
- 4803 Azalea Place Unit 1
- 4801 Azalea Place Unit 2
- 4824 Azalea Place Unit 2
- 4814 Azalea Place Unit 2
- 4900 Happy Dr
- 4805 Wick Mor Dr
- 2362 Briarcliff Dr
- 2401 Crislisa Dr
- 4407 Thadway Dr
- 0 Humbert Rd Unit MAR25006502
- 0 Humbert Rd Unit MAR25003159
- 4408 Natchez Ln
- 4442 Delta Queen Ln
- 0 Humbert Rd Unit MIS25052876
- 5661 Humbert Rd
- 5667 Humbert Rd
- 00 Pine Ridge Lot#52 Dr
- 421 Saint John Dr
- 212 Pine Ridge Dr
- 4618 Camellia Place
- 4609 Wisteria Dr
- 4610 Camellia Place
- 4611 Wisteria Dr
- 4620 Camellia Place
- 4613 Wisteria Dr
- 4608 Camellia Place
- 4613 Camellia Place
- 4615 Camellia Place
- 4622 Camellia Place
- 4617 Camellia Place
- 4611 Camellia Place
- 4608 Wisteria Dr
- 4615 Wisteria Dr
- 4619 Camellia Place
- 4610 Wisteria Dr
- 4612 Wisteria
- 4609 Camellia Place
- 4606 Camellia Place
- 4624 Camellia Place