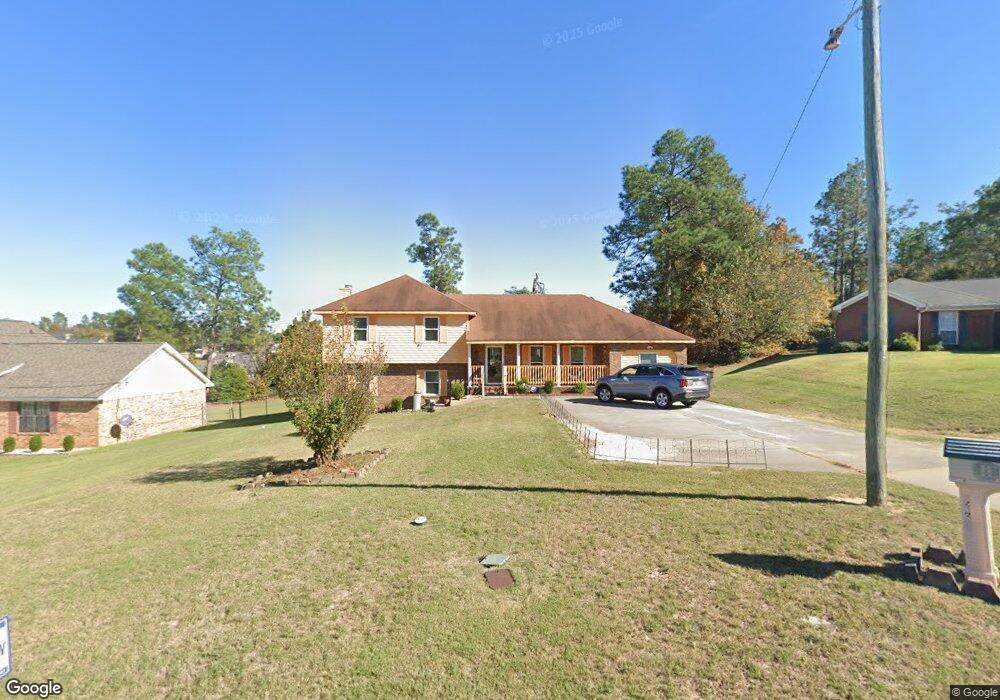
4616 Shadow Moss Ct Augusta, GA 30906
Pepperidge NeighborhoodEstimated Value: $230,000 - $260,000
4
Beds
3
Baths
2,024
Sq Ft
$120/Sq Ft
Est. Value
About This Home
This home is located at 4616 Shadow Moss Ct, Augusta, GA 30906 and is currently estimated at $241,948, approximately $119 per square foot. 4616 Shadow Moss Ct is a home located in Richmond County with nearby schools including Tobacco Road Elementary School, Pine Hill Middle School, and Johnson Magnet.
Ownership History
Date
Name
Owned For
Owner Type
Purchase Details
Closed on
May 12, 2008
Sold by
Watson Aurelia A
Bought by
Watson Lonnie E
Current Estimated Value
Home Financials for this Owner
Home Financials are based on the most recent Mortgage that was taken out on this home.
Original Mortgage
$143,622
Outstanding Balance
$89,230
Interest Rate
5.86%
Mortgage Type
FHA
Estimated Equity
$152,718
Purchase Details
Closed on
Oct 5, 1993
Sold by
Good Investments Inc
Bought by
Watson Lonnie E Watson Aurelia A
Purchase Details
Closed on
Sep 30, 1993
Sold by
Good Investments In
Bought by
Watson Lonnie E
Purchase Details
Closed on
Apr 6, 1993
Sold by
Ridge Forest Development Inc
Bought by
Good Investments Inc
Purchase Details
Closed on
Mar 29, 1993
Sold by
.Ridge Forest Develo
Bought by
Good Investments In
Purchase Details
Closed on
Nov 27, 1991
Sold by
Dross David L Miller Larry D Mccaslin Cl
Bought by
Ridge Forest Development Inc
Create a Home Valuation Report for This Property
The Home Valuation Report is an in-depth analysis detailing your home's value as well as a comparison with similar homes in the area
Home Values in the Area
Average Home Value in this Area
Purchase History
| Date | Buyer | Sale Price | Title Company |
|---|---|---|---|
| Watson Lonnie E | -- | None Available | |
| Watson Lonnie E Watson Aurelia A | -- | -- | |
| Watson Lonnie E | $95,000 | -- | |
| Good Investments Inc | -- | -- | |
| Ridge Forest Development Inc | -- | -- | |
| Good Investments In | $13,900 | -- | |
| Ridge Forest Development Inc | -- | -- |
Source: Public Records
Mortgage History
| Date | Status | Borrower | Loan Amount |
|---|---|---|---|
| Open | Watson Lonnie E | $143,622 |
Source: Public Records
Tax History
| Year | Tax Paid | Tax Assessment Tax Assessment Total Assessment is a certain percentage of the fair market value that is determined by local assessors to be the total taxable value of land and additions on the property. | Land | Improvement |
|---|---|---|---|---|
| 2025 | $470 | $92,604 | $10,000 | $82,604 |
| 2024 | $470 | $92,336 | $10,000 | $82,336 |
| 2023 | $406 | $89,540 | $10,000 | $79,540 |
| 2022 | $396 | $66,182 | $10,000 | $56,182 |
| 2021 | $974 | $54,840 | $10,000 | $44,840 |
| 2020 | $1,806 | $54,840 | $10,000 | $44,840 |
| 2019 | $1,909 | $54,840 | $10,000 | $44,840 |
| 2018 | $1,919 | $54,746 | $10,000 | $44,746 |
| 2017 | $1,938 | $53,545 | $10,000 | $43,545 |
| 2016 | $1,849 | $50,764 | $10,000 | $40,764 |
| 2015 | $1,861 | $50,764 | $10,000 | $40,764 |
| 2014 | $1,848 | $50,290 | $10,000 | $40,290 |
Source: Public Records
Map
Nearby Homes
- 4104 Short Leaf Ct
- 4349 White Pines Ct
- 3346 Thames Place
- 3388 Thames Place
- 3414 Essex Place
- 3758 Bansbury Place
- 3411 Essex Place
- 3434 Thames Place
- 2219 Travis Rd
- 2104 Travis Rd
- 2120 Faircrest Ave
- 4213 Stone Rd
- 4211 Stone Rd
- 3545 Monte Carlo Dr
- 3622 Seelye Dr
- 3630 Windsor Spring Road Rd
- 3640 Elliott Blvd
- 2264 Basswood Dr
- 2104 Oakleaf Way
- 2403 Travis Rd
- 4618 Shadow Moss Ct
- 4612 Shadow Moss Ct
- 4715 Broad Oak Ct
- 4619 Shadow Moss Ct
- 4713 Broad Oak Ct
- 4717 Broad Oak Ct
- 4613 Shadow Moss Ct
- 4610 Shadow Moss Ct
- 4611 Shadow Moss Ct
- 4615 Shadow Moss Ct
- 4711 Broad Oak Ct
- 4617 Shadow Moss Ct
- 4709 Broad Oak Ct
- 4609 Shadow Moss Ct
- 4608 Shadow Moss Ct
- 0 Shadow Moss Ct
- 4707 Broad Oak Ct
- 4606 Shadow Moss Ct
- 4424 Elk Grove Trail
- 4428 Elk Grove Trail
Your Personal Tour Guide
Ask me questions while you tour the home.