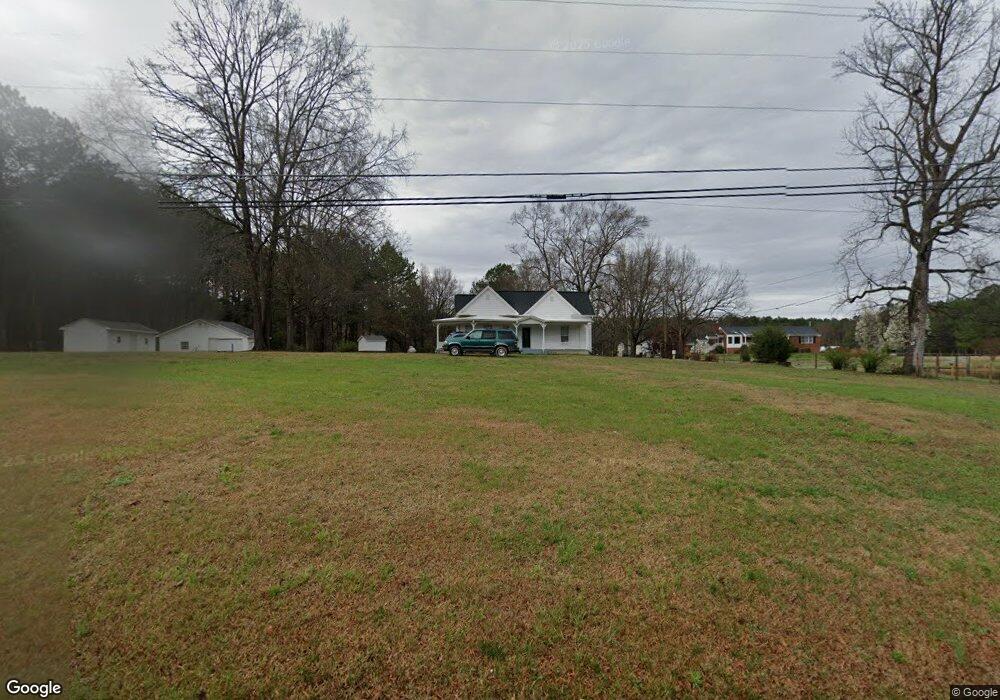
4617 Cheek Rd Durham, NC 27704
Eastern Durham NeighborhoodEstimated Value: $283,634 - $363,000
3
Beds
2
Baths
1,591
Sq Ft
$203/Sq Ft
Est. Value
About This Home
This home is located at 4617 Cheek Rd, Durham, NC 27704 and is currently estimated at $323,409, approximately $203 per square foot. 4617 Cheek Rd is a home located in Durham County with nearby schools including Glenn Elementary, John W Neal Middle School, and Southern School of Energy & Sustainability.
Ownership History
Date
Name
Owned For
Owner Type
Purchase Details
Closed on
Oct 15, 2009
Sold by
Recktenwald Charles L and Recktenwald Barbara J
Bought by
Recktenwald Charles L
Current Estimated Value
Purchase Details
Closed on
Sep 21, 2004
Sold by
Newman Tyrone K
Bought by
Recktenwald Charles L and Recktenwald Barbara J
Home Financials for this Owner
Home Financials are based on the most recent Mortgage that was taken out on this home.
Original Mortgage
$121,950
Outstanding Balance
$32,340
Interest Rate
5.78%
Mortgage Type
Credit Line Revolving
Estimated Equity
$291,069
Purchase Details
Closed on
May 30, 2002
Sold by
Mcdonald Michael W and Mcdonald Tonya Mcdowell
Bought by
Newman Tyrone K
Home Financials for this Owner
Home Financials are based on the most recent Mortgage that was taken out on this home.
Original Mortgage
$95,850
Interest Rate
8.99%
Create a Home Valuation Report for This Property
The Home Valuation Report is an in-depth analysis detailing your home's value as well as a comparison with similar homes in the area
Home Values in the Area
Average Home Value in this Area
Purchase History
| Date | Buyer | Sale Price | Title Company |
|---|---|---|---|
| Recktenwald Charles L | -- | None Available | |
| Recktenwald Charles L | $135,500 | -- | |
| Newman Tyrone K | $106,500 | -- |
Source: Public Records
Mortgage History
| Date | Status | Borrower | Loan Amount |
|---|---|---|---|
| Open | Recktenwald Charles L | $121,950 | |
| Previous Owner | Newman Tyrone K | $95,850 | |
| Previous Owner | Newman Tyrone K | $42,000 |
Source: Public Records
Tax History Compared to Growth
Tax History
| Year | Tax Paid | Tax Assessment Tax Assessment Total Assessment is a certain percentage of the fair market value that is determined by local assessors to be the total taxable value of land and additions on the property. | Land | Improvement |
|---|---|---|---|---|
| 2025 | $916 | $283,815 | $136,600 | $147,215 |
| 2024 | $916 | $160,509 | $45,835 | $114,674 |
| 2023 | $1,702 | $160,509 | $45,835 | $114,674 |
| 2022 | $1,617 | $160,509 | $45,835 | $114,674 |
| 2021 | $1,356 | $160,509 | $45,835 | $114,674 |
| 2020 | $1,340 | $160,509 | $45,835 | $114,674 |
| 2019 | $20 | $175,687 | $45,835 | $129,852 |
| 2018 | $1,198 | $131,356 | $32,175 | $99,181 |
| 2017 | $1,185 | $131,356 | $32,175 | $99,181 |
| 2016 | $1,149 | $131,356 | $32,175 | $99,181 |
| 2015 | $1,200 | $113,876 | $34,976 | $78,900 |
| 2014 | $1,200 | $113,876 | $34,976 | $78,900 |
Source: Public Records
Map
Nearby Homes
- 4103 Cheek Rd
- 2204 Fletchers Ridge Dr
- 4300-4304 Cheek Rd
- 2901 Burton Rd
- 2651 Burton Rd
- 1202 Carpenter Falls Ave
- 1204 Carpenter Falls Ave
- 1214 Carpenter Falls Ave
- 1102 Carpenter Falls Ave
- 1106 Carpenter Falls Ave
- 112 Eastern Teal Dr
- 608 Clearfield Dr
- 1828 Fletchers Chapel Rd
- 1212 Opal Ln
- 1213 Opal Ln
- 2810 Catamount Ct
- 1104 Pebblestone Dr
- 1209 Opal Ln
- 3721 Brightwood Ln
- 1205 Opal Ln
- 4607 Cheek Rd
- 4603 Cheek Rd
- 4605 Cheek Rd
- 4616 Cheek Rd
- 4809 Cheek Rd
- 4600 Cheek Rd
- 4531 Cheek Rd
- 4813 Cheek Rd
- 4810 Cheek Rd
- 4522 Cheek Rd
- 2502 Hollyheight Dr
- 2502 Holly Heights Rd
- 2502 Holly Heights Rd
- 2501 Holly Heights Rd
- 2501 Holly Heights Ave
- 2904 Redwood Rd
- 2904 Redwood Rd
- 3006 Redwood Rd
- 4510 Cheek Rd
- 3002 Redwood Rd