Estimated Value: $332,000 - $356,000
2
Beds
2
Baths
1,458
Sq Ft
$237/Sq Ft
Est. Value
About This Home
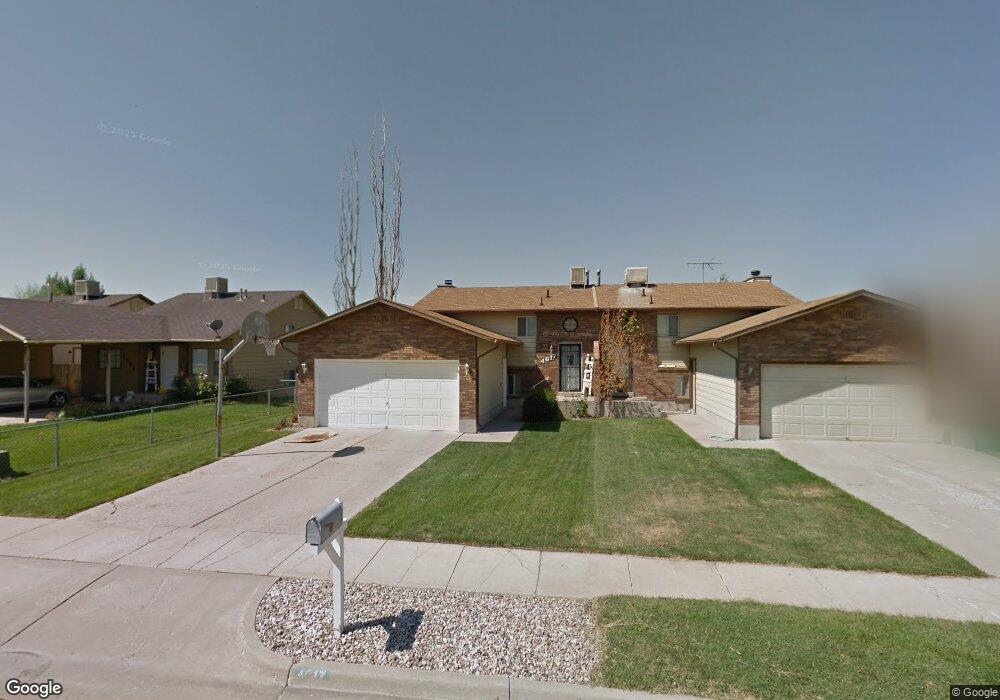
This home is located at 4617 S 3900 W, Roy, UT 84067 and is currently estimated at $345,184, approximately $236 per square foot. 4617 S 3900 W is a home located in Weber County with nearby schools including West Haven School, Sand Ridge Junior High School, and Roy High School.
Ownership History
Date
Name
Owned For
Owner Type
Purchase Details
Closed on
Nov 17, 2016
Bought by
Talbot Jordan
Current Estimated Value
Home Financials for this Owner
Home Financials are based on the most recent Mortgage that was taken out on this home.
Original Mortgage
$136,482
Outstanding Balance
$111,331
Interest Rate
3.94%
Estimated Equity
$233,853
Purchase Details
Closed on
May 20, 2013
Sold by
Atkinson Eric A and Atkinson Jeanne C
Bought by
Ford Preston
Home Financials for this Owner
Home Financials are based on the most recent Mortgage that was taken out on this home.
Original Mortgage
$6,509
Interest Rate
3.41%
Mortgage Type
Stand Alone Second
Purchase Details
Closed on
Jul 15, 2002
Sold by
Solorzano Ana
Bought by
Atkinson Eric A
Home Financials for this Owner
Home Financials are based on the most recent Mortgage that was taken out on this home.
Original Mortgage
$94,516
Interest Rate
6.71%
Mortgage Type
FHA
Create a Home Valuation Report for This Property
The Home Valuation Report is an in-depth analysis detailing your home's value as well as a comparison with similar homes in the area
Home Values in the Area
Average Home Value in this Area
Purchase History
| Date | Buyer | Sale Price | Title Company |
|---|---|---|---|
| Talbot Jordan | -- | -- | |
| Ford Preston | -- | Backman Title Services Ltd | |
| Atkinson Eric A | -- | Associated Title |
Source: Public Records
Mortgage History
| Date | Status | Borrower | Loan Amount |
|---|---|---|---|
| Open | Talbot Jordan | $136,482 | |
| Closed | Talbot Jordan | -- | |
| Previous Owner | Ford Preston | $6,509 | |
| Previous Owner | Atkinson Eric A | $94,516 | |
| Closed | Atkinson Eric A | $3,071 |
Source: Public Records
Tax History Compared to Growth
Tax History
| Year | Tax Paid | Tax Assessment Tax Assessment Total Assessment is a certain percentage of the fair market value that is determined by local assessors to be the total taxable value of land and additions on the property. | Land | Improvement |
|---|---|---|---|---|
| 2025 | $1,724 | $304,064 | $96,460 | $207,604 |
| 2024 | $1,683 | $164,450 | $53,053 | $111,397 |
| 2023 | $1,624 | $158,950 | $48,337 | $110,613 |
| 2022 | $1,726 | $172,150 | $45,542 | $126,608 |
| 2021 | $1,427 | $236,000 | $58,364 | $177,636 |
| 2020 | $1,176 | $178,000 | $58,364 | $119,636 |
| 2019 | $1,217 | $174,000 | $33,723 | $140,277 |
| 2018 | $1,198 | $162,000 | $29,820 | $132,180 |
| 2017 | $1,044 | $133,000 | $29,820 | $103,180 |
| 2016 | $1,016 | $69,727 | $16,480 | $53,247 |
| 2015 | $978 | $69,727 | $16,480 | $53,247 |
| 2014 | $886 | $62,429 | $16,480 | $45,949 |
Source: Public Records
Map
Nearby Homes
- 4024 W 4650 S
- 4094 W 4700 S
- 3692 W 4625 S
- 4097 W 4750 S
- 3669 W 4625 S
- 3671 W 4700 S
- 3652 W 4625 S
- 3632 W 4650 S
- 3627 W 4650 S
- Villages Townhome Plan at Green Farm - Villages
- 4106 W 4875 S
- 4890 S 4075 W
- 4141 W 4875 S
- 3820 Foxglen Dr
- Poplar Plan at Highgate Cove
- Pando Plan at Highgate Cove
- 4990 S 4075 W
- 4021 W 5000 S
- 4756 S 4300 W
- 3524 W 4835 S Unit 22