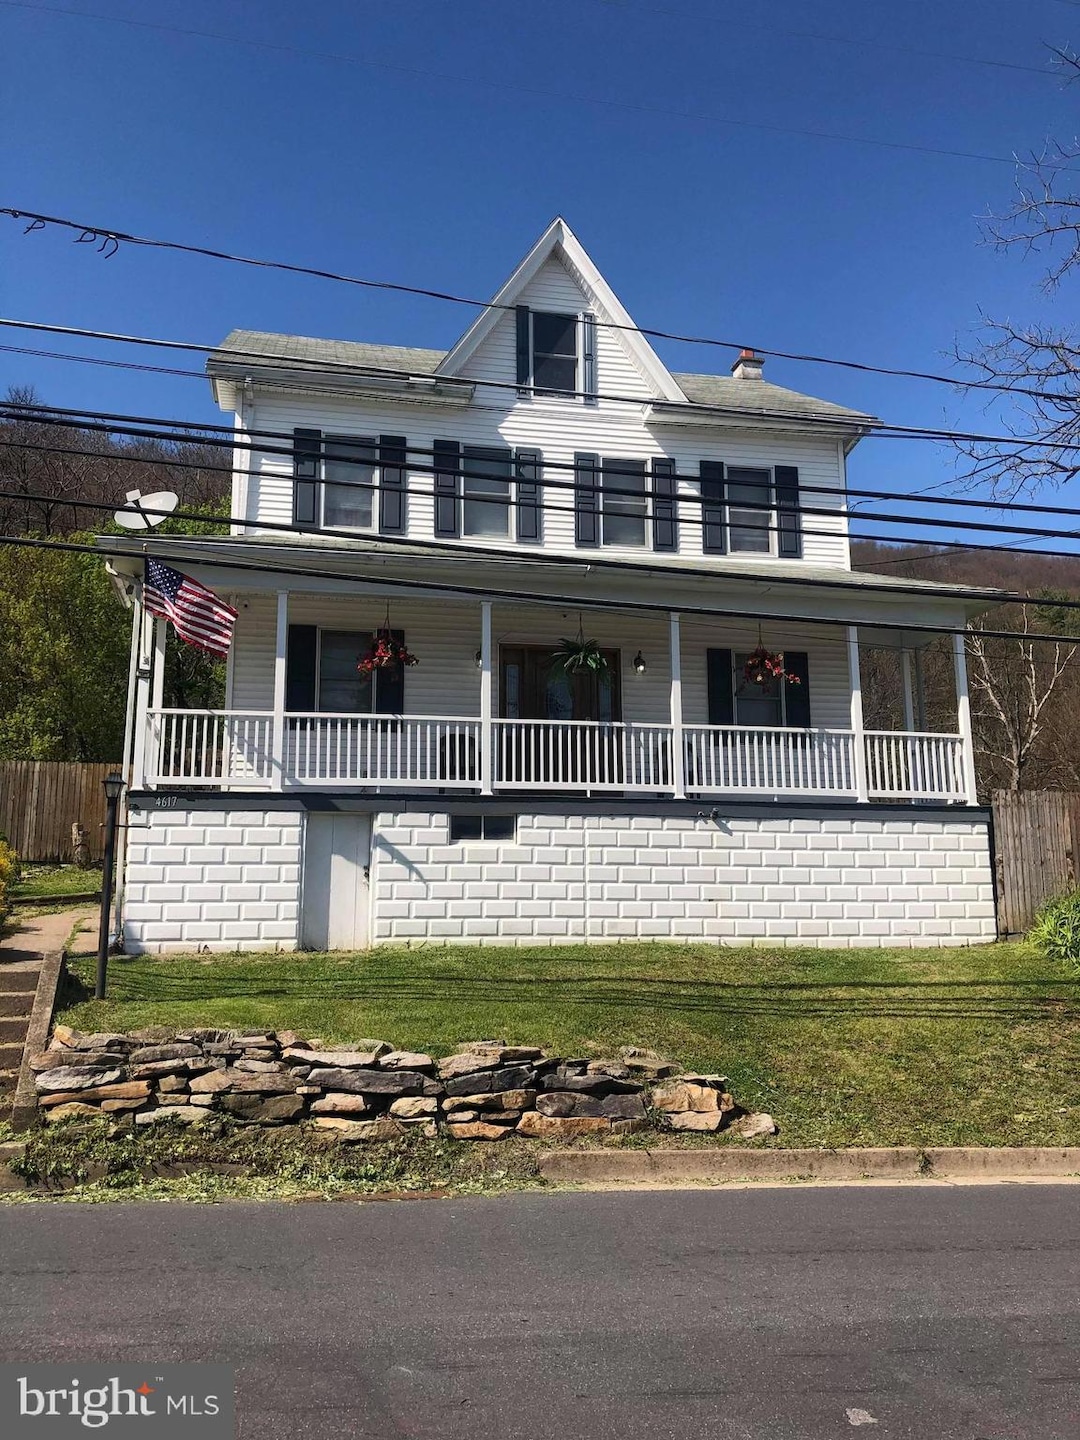
4617 Upper Rd Shamokin, PA 17872
Estimated payment $667/month
Highlights
- Traditional Architecture
- Window Unit Cooling System
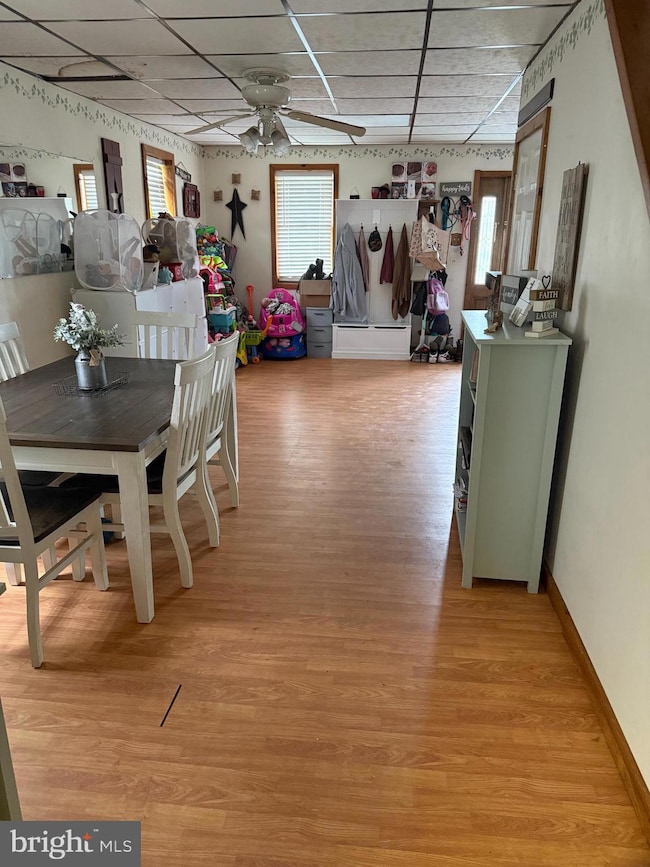
- Dining Room
- No HOA
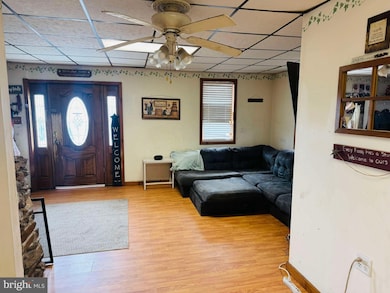
- Living Room
- Hot Water Heating System
About This Home
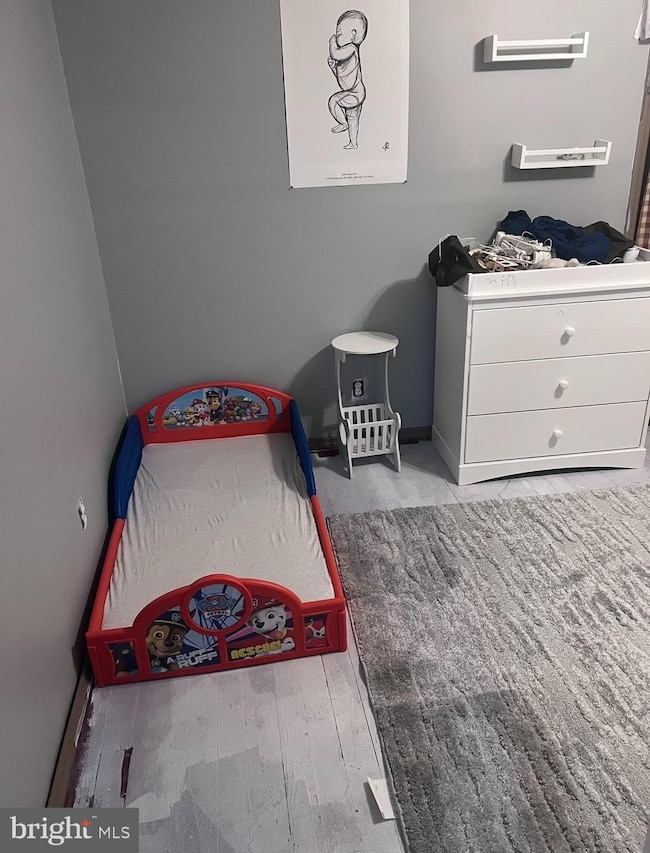
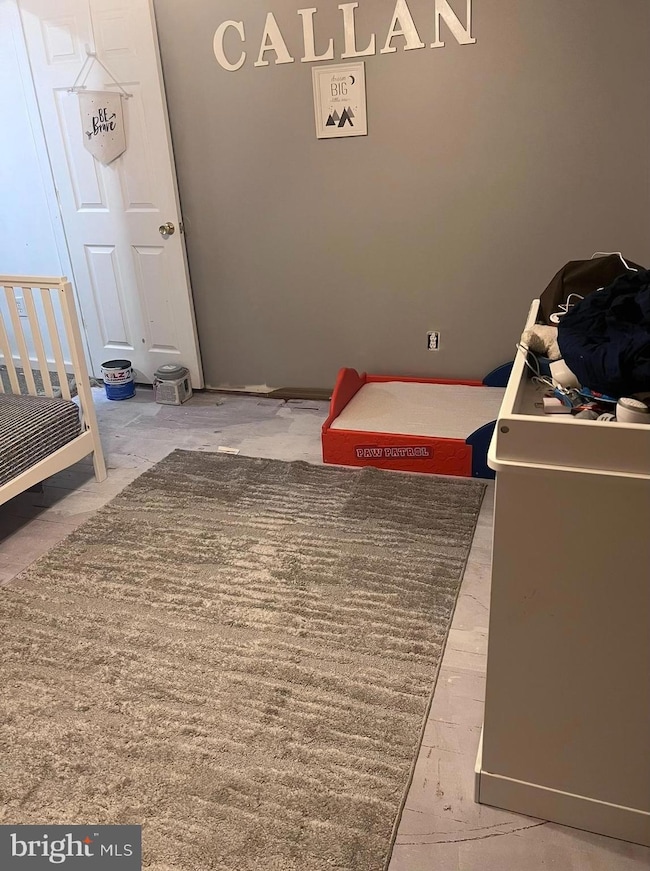
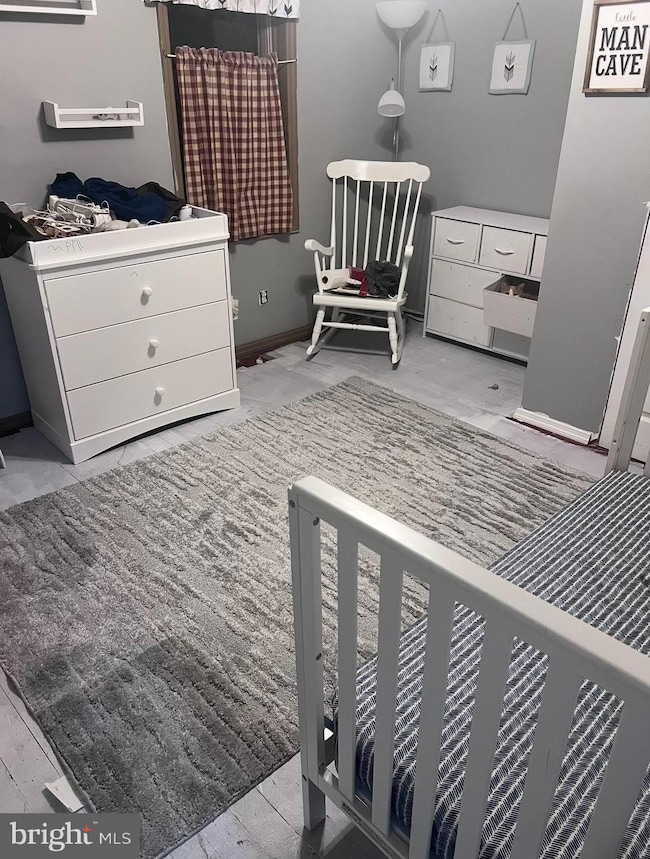
Single Family home in Shamokin School District. Home has 4 bedrooms and 2 baths, propane fireplace and pellot stove in kitchen. Furnace needs work. Call listing agent with any questions. Home is subject to both short sale and bankruptcy court approval.
Listing Agent
(717) 612-9901 tstraub@homefindergroup.net Straub & Associates Real Estate Brokerage Phone: 7176129901 License #RM419444 Listed on: 09/22/2025
Home Details
Home Type
- Single Family
Est. Annual Taxes
- $311
Year Built
- Built in 1920
Lot Details
- 3,049 Sq Ft Lot
Parking
- On-Street Parking
Home Design
- Traditional Architecture
- Block Foundation
- Composition Roof
- Vinyl Siding
- Stick Built Home
Interior Spaces
- Property has 2 Levels
- Gas Fireplace
- Living Room
- Dining Room
- Stove
- Basement
Bedrooms and Bathrooms
- 1 Bedroom
Utilities
- Window Unit Cooling System
- Heating System Uses Oil
- Heating System Powered By Owned Propane
- Hot Water Heating System
- Electric Water Heater
- Private Sewer
Community Details
- No Home Owners Association
Listing and Financial Details
- Tax Lot 037
- Assessor Parcel Number 001-00-077-037
Map
Tax History
| Year | Tax Paid | Tax Assessment Tax Assessment Total Assessment is a certain percentage of the fair market value that is determined by local assessors to be the total taxable value of land and additions on the property. | Land | Improvement |
|---|---|---|---|---|
| 2025 | $343 | $3,920 | $740 | $3,180 |
| 2024 | $311 | $3,920 | $740 | $3,180 |
| 2023 | $311 | $3,920 | $740 | $3,180 |
| 2022 | $304 | $3,920 | $740 | $3,180 |
| 2021 | $298 | $3,920 | $740 | $3,180 |
| 2020 | $292 | $3,920 | $740 | $3,180 |
| 2019 | $285 | $3,920 | $740 | $3,180 |
| 2018 | $281 | $3,920 | $740 | $3,180 |
| 2017 | $263 | $3,920 | $740 | $3,180 |
| 2016 | -- | $3,920 | $740 | $3,180 |
| 2015 | -- | $3,920 | $740 | $3,180 |
| 2014 | -- | $3,920 | $740 | $3,180 |
Property History
| Date | Event | Price | List to Sale | Price per Sq Ft |
|---|---|---|---|---|
| 12/06/2025 12/06/25 | Pending | -- | -- | -- |
| 10/06/2025 10/06/25 | Price Changed | $120,000 | -14.0% | -- |
| 09/22/2025 09/22/25 | For Sale | $139,500 | -- | -- |
Purchase History
| Date | Type | Sale Price | Title Company |
|---|---|---|---|
| Deed | $108,000 | None Available | |
| Interfamily Deed Transfer | -- | None Available | |
| Deed | $77,500 | None Available |
Mortgage History
| Date | Status | Loan Amount | Loan Type |
|---|---|---|---|
| Open | $111,053 | New Conventional | |
| Previous Owner | $76,095 | FHA |
Source: Bright MLS
MLS Number: PANU2002680
APN: 001-00-077-037
Disclaimer: Certain information contained herein is derived from information provided by parties other than Homes.com. All information provided is deemed reliable, but is not guaranteed to be accurate and should be independently verified.
![]() The data relating to real estate for sale on this website appears in part through the BRIGHT Internet Data Exchange program, a voluntary cooperative exchange of property listing data between licensed real estate brokerage firms, and is provided by BRIGHT through a licensing agreement.
The data relating to real estate for sale on this website appears in part through the BRIGHT Internet Data Exchange program, a voluntary cooperative exchange of property listing data between licensed real estate brokerage firms, and is provided by BRIGHT through a licensing agreement.
Listing information is from various brokers who participate in the Bright MLS IDX program and not all listings may be visible on the site.
The property information being provided on or through the website is for the personal, non-commercial use of consumers and such information may not be used for any purpose other than to identify prospective properties consumers may be interested in purchasing.
Some properties which appear for sale on the website may no longer be available because they are for instance, under contract, sold or are no longer being offered for sale.
Property information displayed is deemed reliable but is not guaranteed.
Copyright 2026 Bright MLS, Inc.
- 4685 Upper Rd
- 4556 Upper Rd
- 456 S Shamokin St
- 400 and 402 S Shamokin St
- 328 S Shamokin St
- 704 Bear Valley Ave
- 533 S Market St
- 303 S Rock St
- 1674 Pulaski Ave
- 213 S Franklin St
- 135 W Montgomery St
- 1542 Pulaski Ave
- 347 S 7th St
- 1705 Pulaski Ave
- 1701 Pulaski Ave
- 206 S Shamokin St
- 138 S Franklin St
- 924 Hemlock St
- 1227 Pulaski Ave
- 338 S Market St

Ask me questions while you tour the home.