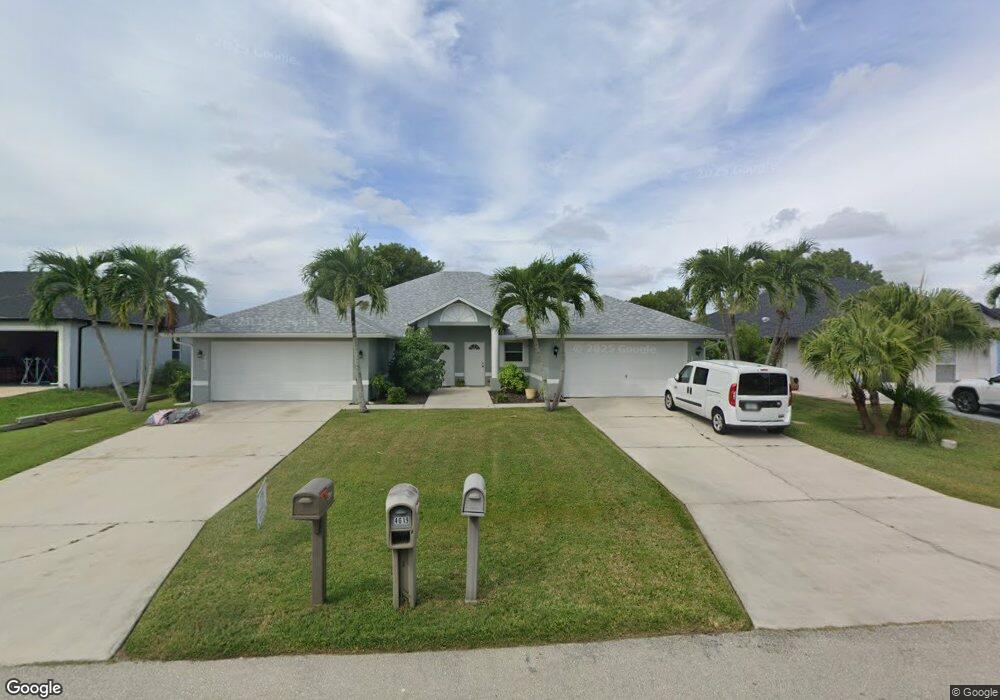
4618/4620 SW 7th Place Cape Coral, FL 33914
Pelican NeighborhoodEstimated Value: $501,000 - $542,000
6
Beds
4
Baths
2,840
Sq Ft
$184/Sq Ft
Est. Value
About This Home
This home is located at 4618/4620 SW 7th Place, Cape Coral, FL 33914 and is currently estimated at $522,333, approximately $183 per square foot. 4618/4620 SW 7th Place is a home with nearby schools including Cape Elementary School, Caloosa Elementary School, and Tropic Isles Elementary School.
Ownership History
Date
Name
Owned For
Owner Type
Purchase Details
Closed on
Nov 15, 2022
Sold by
Cove Joseph E
Bought by
Joseph E Cove Jr Trust
Current Estimated Value
Purchase Details
Closed on
Sep 22, 2017
Sold by
Brush Donna and Brush Garfield
Bought by
Cove Joseph E
Purchase Details
Closed on
Jul 18, 2008
Sold by
Us Bank National Association
Bought by
Brush Donna and Brush Garfield
Purchase Details
Closed on
Feb 24, 2006
Sold by
Tobin Brenda A and Tobin Ben E
Bought by
Darbouze Romanes and Darbouze Solienne
Home Financials for this Owner
Home Financials are based on the most recent Mortgage that was taken out on this home.
Original Mortgage
$321,600
Interest Rate
7.3%
Mortgage Type
Commercial
Purchase Details
Closed on
May 12, 2004
Sold by
Tobin Brenda and Brenda A Tobin Revocable Trust
Bought by
Tobin Brenda A and Ben E Tobin Revocable Trust
Create a Home Valuation Report for This Property
The Home Valuation Report is an in-depth analysis detailing your home's value as well as a comparison with similar homes in the area
Home Values in the Area
Average Home Value in this Area
Purchase History
| Date | Buyer | Sale Price | Title Company |
|---|---|---|---|
| Joseph E Cove Jr Trust | $100 | -- | |
| Cove Joseph E | $295,000 | Omega Title Llc | |
| Brush Donna | $130,000 | Attorney | |
| Darbouze Romanes | $402,000 | Platinum Land Title Agency I | |
| Tobin Brenda A | -- | -- |
Source: Public Records
Mortgage History
| Date | Status | Borrower | Loan Amount |
|---|---|---|---|
| Previous Owner | Darbouze Romanes | $321,600 |
Source: Public Records
Tax History Compared to Growth
Tax History
| Year | Tax Paid | Tax Assessment Tax Assessment Total Assessment is a certain percentage of the fair market value that is determined by local assessors to be the total taxable value of land and additions on the property. | Land | Improvement |
|---|---|---|---|---|
| 2025 | $8,648 | $472,728 | $69,445 | $395,485 |
| 2024 | $8,648 | $459,580 | $70,846 | $380,002 |
| 2023 | $8,494 | $448,382 | $100,224 | $348,158 |
| 2022 | $7,303 | $388,566 | $72,000 | $316,566 |
| 2021 | $5,684 | $270,042 | $45,000 | $225,042 |
| 2020 | $5,394 | $244,671 | $40,000 | $204,671 |
| 2019 | $5,130 | $232,562 | $40,000 | $192,562 |
| 2018 | $5,257 | $234,977 | $35,000 | $199,977 |
Source: Public Records
Map
Nearby Homes
- 4616 Skyline Blvd Unit 104
- 724 SW 47th St Unit 205
- 710 SW 47th St Unit 103
- 4618 SW 7th Ave
- 4707 SW 8th Place
- 4602 Skyline Blvd
- 4708 SW 8th Place Unit 203
- 4528 SW 7th Place
- 829 SW 47th Terrace Unit 204
- 4538 SW 6th Place
- 4520 Skyline Blvd Unit 206
- 4520 Skyline Blvd Unit 208
- 4803 Skyline Blvd
- 808 Cape Coral Pkwy W Unit 204
- 841 SW 47th Terrace Unit 202
- 838 SW 47th Terrace Unit A101
- 626 Cape Coral Pkwy W
- 610 SW 47th Terrace Unit 2
- 4514 SW 8th Place Unit 11
- 4513 SW 8th Ct Unit 109
- 4620 SW 7th Place
- 4616 SW 7th Place
- 4614 SW 7th Place Unit 44
- 4622 SW 7th Place
- 4619/4621 Skyline Blvd
- 4621 Skyline Blvd
- 4613 Skyline Blvd Unit 1-8
- 4613 Skyline Blvd
- 4613 Skyline Blvd Unit 108
- 4628 SW 7th Place
- 4615/4617 SW 7th Place
- 4625 Skyline Blvd
- 4623 SW 7th Place
- 4623 SW 7th Place
- 4625 SW 7th Place
- 4619 Skyline Blvd
- 4611 SW 7th Place
- 727/729 SW 47th St
- 4606 SW 7th Ave