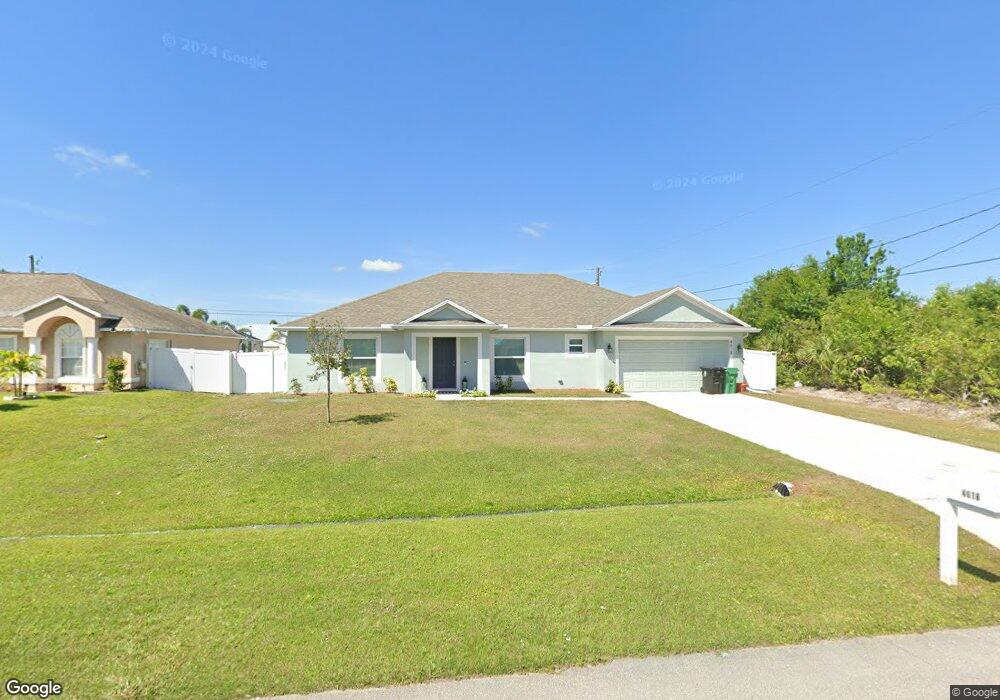
4618 SW Caisson St Port Saint Lucie, FL 34953
Becker Ridge NeighborhoodEstimated Value: $421,769 - $484,000
3
Beds
2
Baths
10,000
Sq Ft
$45/Sq Ft
Est. Value
About This Home
This home is located at 4618 SW Caisson St, Port Saint Lucie, FL 34953 and is currently estimated at $451,692, approximately $45 per square foot. 4618 SW Caisson St is a home with nearby schools including Windmill Point Elementary School, Oak Hammock K-8 School, and Bayshore Elementary School.
Ownership History
Date
Name
Owned For
Owner Type
Purchase Details
Closed on
Feb 24, 2021
Sold by
Holiday Builders Inc
Bought by
Quinn Austin R and Vetter Kristen A
Current Estimated Value
Home Financials for this Owner
Home Financials are based on the most recent Mortgage that was taken out on this home.
Original Mortgage
$270,774
Outstanding Balance
$241,070
Interest Rate
2.7%
Mortgage Type
New Conventional
Estimated Equity
$210,622
Purchase Details
Closed on
Nov 6, 2019
Sold by
Paxson Llc
Bought by
Holiday Builders Inc
Purchase Details
Closed on
Oct 25, 2019
Sold by
Beauchamp Patrisha A
Bought by
Paxson Llc
Purchase Details
Closed on
Mar 2, 2005
Sold by
Valle Joseph Dalla and Valle Anna Dalla
Bought by
Beauchamp A Gerard and Beauchamp Patrisha A
Purchase Details
Closed on
Mar 5, 2004
Sold by
Tesoriero Susan B
Bought by
Dalla-Valle Joseph and Dalla-Valle Anna
Purchase Details
Closed on
May 15, 2002
Sold by
Court Clerk Circuit
Bought by
Tesoriero Susan B
Create a Home Valuation Report for This Property
The Home Valuation Report is an in-depth analysis detailing your home's value as well as a comparison with similar homes in the area
Home Values in the Area
Average Home Value in this Area
Purchase History
| Date | Buyer | Sale Price | Title Company |
|---|---|---|---|
| Quinn Austin R | $279,200 | Hb Title Inc | |
| Holiday Builders Inc | $492,000 | Hb Title Inc | |
| Paxson Llc | $25,300 | First International Ttl Inc | |
| Beauchamp A Gerard | $69,000 | South Florida Title Svcs Inc | |
| Dalla-Valle Joseph | $28,000 | -- | |
| Tesoriero Susan B | $3,900 | -- |
Source: Public Records
Mortgage History
| Date | Status | Borrower | Loan Amount |
|---|---|---|---|
| Open | Quinn Austin R | $270,774 |
Source: Public Records
Tax History Compared to Growth
Tax History
| Year | Tax Paid | Tax Assessment Tax Assessment Total Assessment is a certain percentage of the fair market value that is determined by local assessors to be the total taxable value of land and additions on the property. | Land | Improvement |
|---|---|---|---|---|
| 2025 | $7,189 | $346,057 | -- | -- |
| 2024 | $7,058 | $336,305 | -- | -- |
| 2023 | $7,058 | $326,510 | $0 | $0 |
| 2022 | $6,851 | $317,000 | $105,000 | $212,000 |
| 2021 | $1,354 | $38,400 | $38,400 | $0 |
| 2020 | $986 | $25,700 | $25,700 | $0 |
| 2019 | $758 | $25,700 | $25,700 | $0 |
| 2018 | $680 | $19,400 | $19,400 | $0 |
| 2017 | $636 | $14,600 | $14,600 | $0 |
| 2016 | $604 | $12,300 | $12,300 | $0 |
| 2015 | $584 | $11,400 | $11,400 | $0 |
| 2014 | $541 | $7,700 | $0 | $0 |
Source: Public Records
Map
Nearby Homes
- 121 SW Sea Lion Rd
- 221 SW Becker Rd
- 4633 SW Junietta Terrace
- 373 SW Kestor Dr
- 233 SW Becker Rd
- 148 SW Sea Lion Rd
- 4535 SW Sw Fireside Cir
- 243 SW Becker Rd
- 158 SW Sea Lion Rd
- 4552 SW Paley Rd
- 4588 SW Athena Dr
- 4468 SW Athena Dr
- 302 SW Log Dr
- 183 SW Ladybug Dr
- 309 SW Log Dr Unit 38
- 162 SW Milburn Cir
- 398 SW Ryan Ave
- 115 SW South Wakefield Cir
- 4521 SW Darwin Blvd
- 153 SW Becker Rd
- 117 SW Sea Lion Rd
- 4638 SW Caisson St
- 4615 SW Caisson St
- 115 SW Sea Lion Rd
- 4625 SW Caisson St
- 4605 SW Caisson St Unit 251
- 4635 SW Caisson St
- 113 SW Sea Lion Rd
- 4648 SW Caisson St
- 118 SW Sea Lion Rd
- 325 SW Becker Rd
- 116 SW Sea Lion Rd
- 4626 SW Lassiter Terrace
- 4626 SW Lassiter Terrace Unit 242
- 4606 SW Lassiter Terrace
- 120 SW Sea Lion Rd
- 4645 SW Caisson St Unit 2697748-10394
- 4645 SW Caisson St Unit 249
- 209 SW Becker Rd
- 111 SW Sea Lion Rd