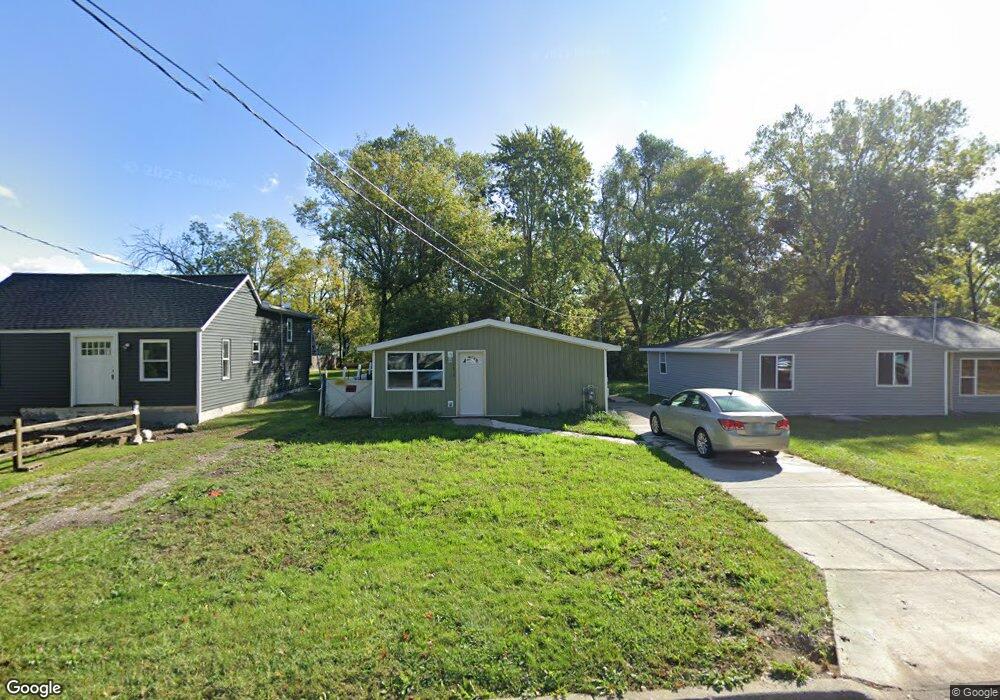
4619 Hughes Rd Lansing, MI 48910
Pleasant Grove NeighborhoodEstimated Value: $80,662 - $97,000
--
Bed
--
Bath
698
Sq Ft
$128/Sq Ft
Est. Value
About This Home
This home is located at 4619 Hughes Rd, Lansing, MI 48910 and is currently estimated at $89,166, approximately $127 per square foot. 4619 Hughes Rd is a home located in Ingham County with nearby schools including Reo Elementary School, Attwood School, and Everett High School.
Ownership History
Date
Name
Owned For
Owner Type
Purchase Details
Closed on
Mar 6, 2023
Sold by
Kruger Bruce
Bought by
Kruger Bruce W
Current Estimated Value
Purchase Details
Closed on
Sep 18, 2014
Sold by
4619 Hughes Road Llc
Bought by
Kruger Bruce and Kruger Patricia
Purchase Details
Closed on
Sep 1, 2014
Sold by
Thayer Tommy and Curtis Karen
Bought by
4619 Hughes Rd Llc
Purchase Details
Closed on
Dec 6, 2013
Sold by
Crofut Nicholas G
Bought by
4619 Hughes Road Llc
Purchase Details
Closed on
Mar 4, 2005
Sold by
Summit Asset Management Co Inc
Bought by
Crofut Nocholas G
Home Financials for this Owner
Home Financials are based on the most recent Mortgage that was taken out on this home.
Original Mortgage
$52,250
Interest Rate
8.15%
Mortgage Type
Fannie Mae Freddie Mac
Purchase Details
Closed on
Jan 1, 1994
Bought by
Rockafellow Robert J
Create a Home Valuation Report for This Property
The Home Valuation Report is an in-depth analysis detailing your home's value as well as a comparison with similar homes in the area
Home Values in the Area
Average Home Value in this Area
Purchase History
| Date | Buyer | Sale Price | Title Company |
|---|---|---|---|
| Kruger Bruce W | -- | None Listed On Document | |
| Kruger Bruce | $7,000 | None Available | |
| 4619 Hughes Rd Llc | -- | None Available | |
| 4619 Hughes Road Llc | -- | None Available | |
| Crofut Nocholas G | $55,000 | Bell Title Company | |
| Summit Asset Management Co Inc | $32,500 | Bell Title Company | |
| Rockafellow Robert J | $26,000 | -- |
Source: Public Records
Mortgage History
| Date | Status | Borrower | Loan Amount |
|---|---|---|---|
| Previous Owner | Crofut Nocholas G | $52,250 | |
| Closed | Crofut Nocholas G | $2,750 |
Source: Public Records
Tax History Compared to Growth
Tax History
| Year | Tax Paid | Tax Assessment Tax Assessment Total Assessment is a certain percentage of the fair market value that is determined by local assessors to be the total taxable value of land and additions on the property. | Land | Improvement |
|---|---|---|---|---|
| 2025 | $1,615 | $41,300 | $4,400 | $36,900 |
| 2024 | $13 | $32,900 | $4,400 | $28,500 |
| 2023 | $1,484 | $22,400 | $4,400 | $18,000 |
| 2022 | $1,358 | $21,100 | $4,400 | $16,700 |
| 2021 | $1,327 | $19,700 | $3,100 | $16,600 |
| 2020 | $1,317 | $18,400 | $3,100 | $15,300 |
| 2019 | $1,270 | $17,600 | $3,100 | $14,500 |
| 2018 | $1,207 | $15,400 | $3,100 | $12,300 |
| 2017 | $1,160 | $15,400 | $3,100 | $12,300 |
| 2016 | $1,525 | $14,900 | $3,100 | $11,800 |
| 2015 | $1,525 | $14,400 | $6,177 | $8,223 |
| 2014 | $1,525 | $14,300 | $8,237 | $6,063 |
Source: Public Records
Map
Nearby Homes
- 4620 Christiansen Rd
- 1729 Reo Rd
- 4628 Pleasant Grove Rd
- 1420 Reo Rd
- 4916 Tressa Dr
- 0 Midwood St
- 1415 Reo Rd
- 1429 Pierce Rd
- 1500 Pierce Rd
- 1422 Pierce Rd
- 1324 N Briarfield Dr
- 2029 Hillcrest St
- 4110 Richmond St
- 4017 Richmond St
- 2311 Greenbelt Dr
- 2416 Midwood St
- VL Hillcrest St
- 2045 Moffitt St
- 4828 Ingham St
- 4414 S Martin Luther King jr Blvd