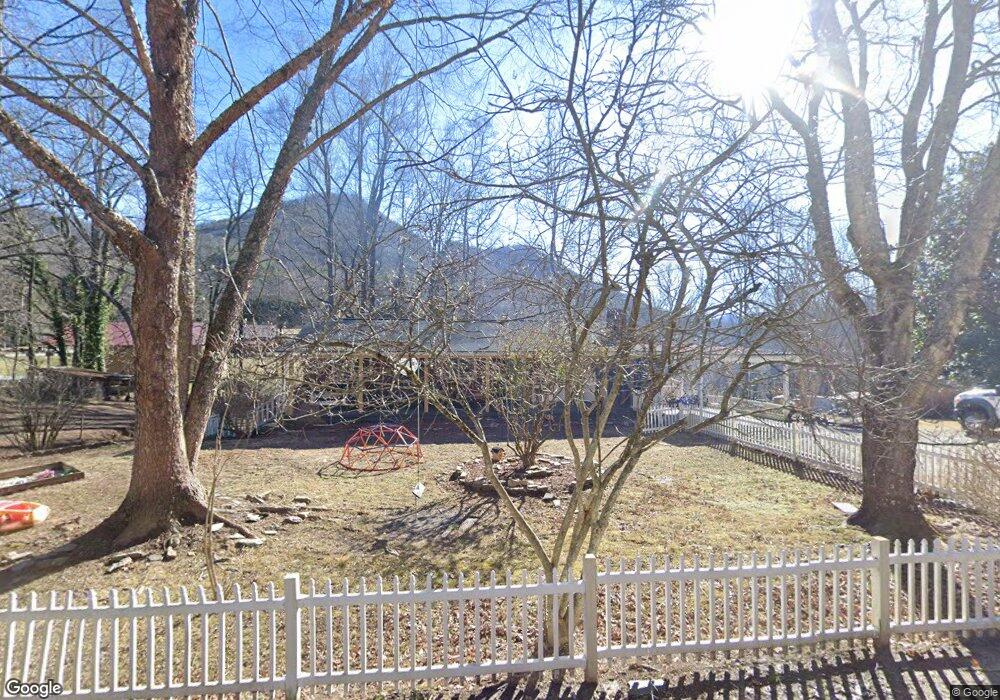
462 Black Branch Rd Rabun Gap, GA 30568
Estimated Value: $181,000 - $364,000
3
Beds
2
Baths
1,248
Sq Ft
$210/Sq Ft
Est. Value
About This Home
This home is located at 462 Black Branch Rd, Rabun Gap, GA 30568 and is currently estimated at $262,267, approximately $210 per square foot. 462 Black Branch Rd is a home located in Rabun County with nearby schools including Rabun County Primary School, Rabun County High School, and Rabun Gap Nacoochee School.
Ownership History
Date
Name
Owned For
Owner Type
Purchase Details
Closed on
May 15, 2020
Sold by
Johnson Amy J
Bought by
Turpin Matthew E and Henslee Brittany
Current Estimated Value
Home Financials for this Owner
Home Financials are based on the most recent Mortgage that was taken out on this home.
Original Mortgage
$106,060
Outstanding Balance
$93,571
Interest Rate
3.3%
Mortgage Type
New Conventional
Estimated Equity
$168,696
Purchase Details
Closed on
Nov 28, 2017
Sold by
Loggins Wanda N
Bought by
Johnson Amy J
Purchase Details
Closed on
Aug 1, 2003
Purchase Details
Closed on
Oct 1, 1994
Bought by
Nix Harold N
Purchase Details
Closed on
Mar 1, 1988
Purchase Details
Closed on
Feb 1, 1988
Purchase Details
Closed on
Sep 1, 1984
Create a Home Valuation Report for This Property
The Home Valuation Report is an in-depth analysis detailing your home's value as well as a comparison with similar homes in the area
Home Values in the Area
Average Home Value in this Area
Purchase History
| Date | Buyer | Sale Price | Title Company |
|---|---|---|---|
| Turpin Matthew E | $105,000 | -- | |
| Turpin Matthew E | $105,000 | -- | |
| Johnson Amy J | -- | -- | |
| Johnson Amy J | -- | -- | |
| -- | -- | -- | |
| -- | -- | -- | |
| Nix Harold N | $56,000 | -- | |
| Nix Harold N | $56,000 | -- | |
| -- | $10,000 | -- | |
| -- | $10,000 | -- | |
| -- | -- | -- | |
| -- | -- | -- | |
| -- | -- | -- | |
| -- | -- | -- |
Source: Public Records
Mortgage History
| Date | Status | Borrower | Loan Amount |
|---|---|---|---|
| Open | Turpin Matthew E | $106,060 | |
| Closed | Turpin Matthew E | $106,060 |
Source: Public Records
Tax History Compared to Growth
Tax History
| Year | Tax Paid | Tax Assessment Tax Assessment Total Assessment is a certain percentage of the fair market value that is determined by local assessors to be the total taxable value of land and additions on the property. | Land | Improvement |
|---|---|---|---|---|
| 2025 | $796 | $49,590 | $8,288 | $41,302 |
| 2024 | $757 | $47,179 | $8,288 | $38,891 |
| 2023 | $800 | $43,725 | $7,800 | $35,925 |
| 2022 | $770 | $42,055 | $7,312 | $34,743 |
| 2021 | $700 | $37,313 | $6,825 | $30,488 |
| 2020 | $370 | $19,096 | $5,460 | $13,636 |
| 2019 | $373 | $19,096 | $5,460 | $13,636 |
| 2018 | $113 | $19,096 | $5,460 | $13,636 |
| 2017 | $112 | $19,096 | $5,460 | $13,636 |
| 2016 | $318 | $30,004 | $5,460 | $24,544 |
| 2015 | $329 | $30,275 | $5,460 | $24,815 |
| 2014 | $330 | $30,275 | $5,460 | $24,815 |
Source: Public Records
Map
Nearby Homes
- 0 Stella Ln Unit 10485082
- 668 Mountainside Dr
- 407 Blackberry Dr
- 333 Favor
- 100 Windsong Ln
- 0 Uplander Unit 10628218
- 0 Uplander Unit M181832
- 0 Winter Ct Unit 35 10139164
- LOT 113 Mountain Ridge Dr
- LOT 112 Mountain Ridge Dr
- 476 Franklin St
- 0 Deep Woods Ln Unit LOT 9 8796010
- LOT 205 Shake Hollow Dr
- 27 Shake Hollow Dr
- LOT 204 Shake Hollow Dr
- LOT 22 Shake Hollow Dr
- 0 John Beck Dockins Rd Unit 10606531
- 0 Shake Hollow Rd Unit 10619107
- 0 Shake Hollow Dr Unit 22681373
- 0 Wolffork Rd Unit 10624471
- 41 Henslee Hollow Ln
- 444 Black Branch Rd
- 13 Ray Wilburn Ln
- 0 Walnut Mountain Rd Unit 11 & 12 8054678
- 0 Walnut Mountain Rd Unit 8892619
- 0 Walnut Mountain Rd Unit 8862348
- 0 Favor Ln Unit 412719
- 0 Favor Ln Unit LOTS 28 - 29
- 325 Black Branch Rd
- 550 Black Branch Rd
- 192 Mountainside Dr
- 635 Black Branch Rd
- 174 Mountainside Dr
- 130 Walnut Mountain Rd
- 144 Henslee Hollow Ln
- 84 Mountainside Dr
- 237 Mountainside Dr
- 42 Po Folks Ln
- 474 Henslee Hollow Ln
- 679 Black Branch Rd